Book Demo
Book Demo

Bring meter, building management system, SCADA, PLC, historian, and operational data into one structured view and see in real time how assets, utilities, and energy flows interact across your facility.
Detect abnormal consumption and asset behavior faster
Understand electricity, cooling, heating, compressed air, and water, in one operational view
Give every team one trusted, live operational view










Most facilities already collect energy and operating data. The problem is that the data is often spread across meters, BMS, SCADA, historians, dashboards, and spreadsheets. That makes it difficult to understand how systems behave together while they are running.
When visibility is delayed, inefficient operating modes, abnormal runtime, or unstable system behavior can continue unnoticed. The result is not only higher energy use. It is slower root-cause analysis, weaker operational transparency, more manual work, and less confidence in daily energy management.


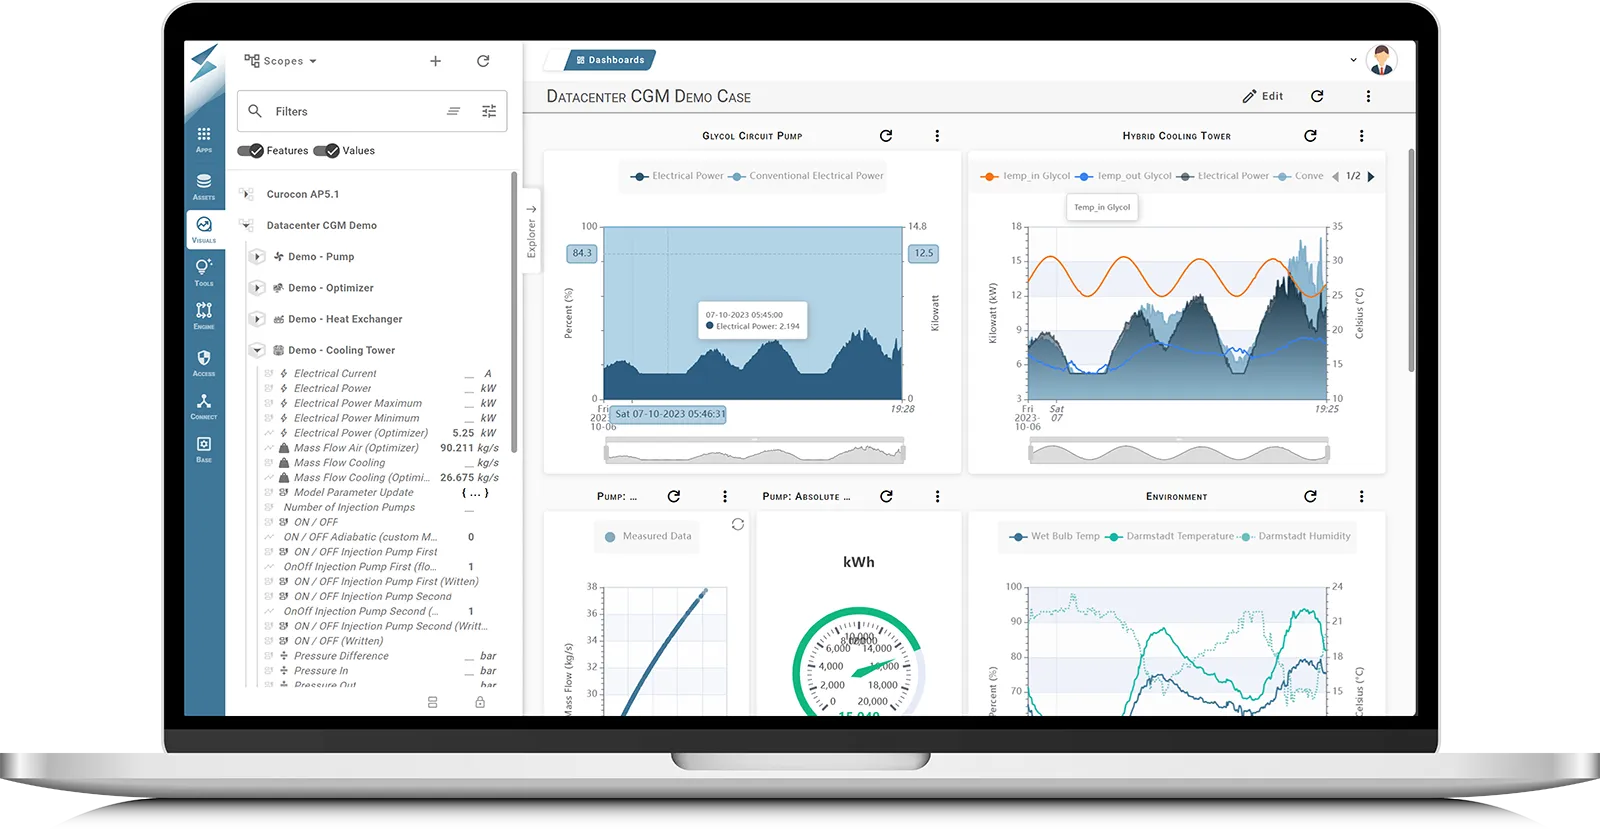
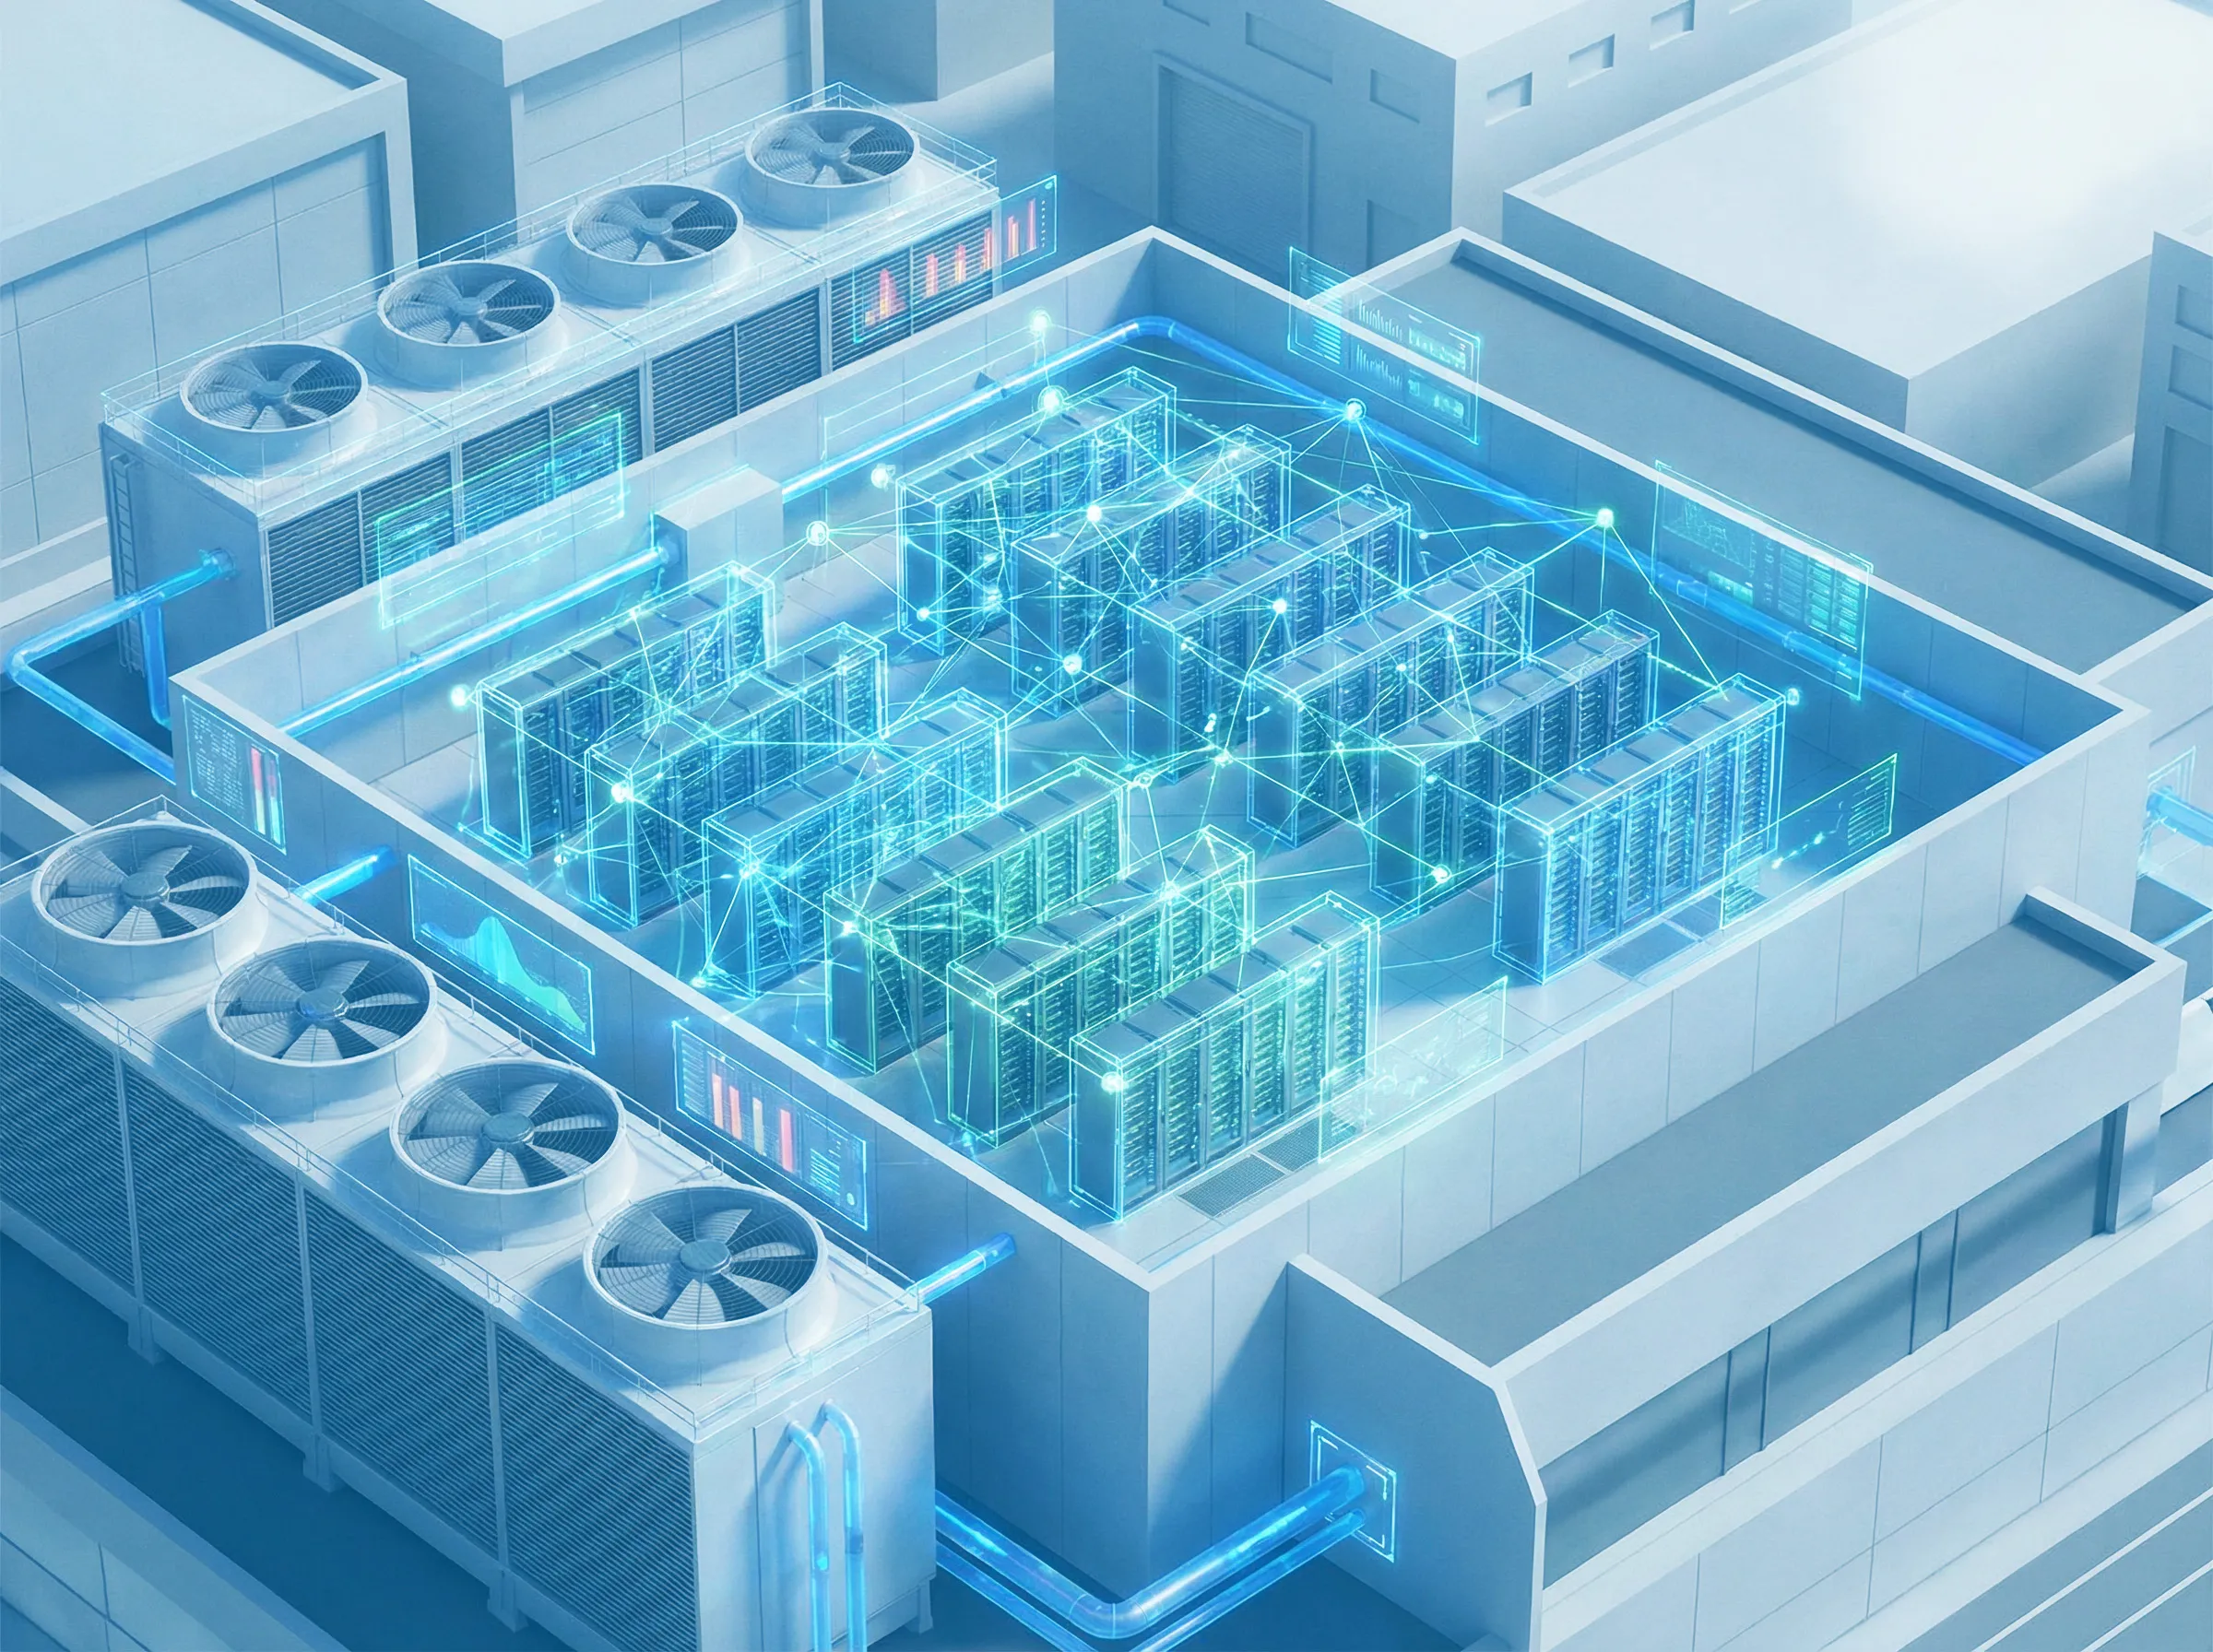
etaONE® connects live data from your existing systems and structures it around how your facility actually operates: sites, systems, utilities, assets, and energy flows. Instead of showing isolated meter values, it creates a shared operational view.

Bring together data from meters, sensors, BMS, SCADA, PLCs, historians, DCIM, EMS, and other connected systems.
Your team sees current system behavior instead of waiting for delayed reports, manual exports, or invoice reviews.

Organize data into asset types, system relationships, utility paths, and operational scopes. A temperature, power value, runtime, or valve position becomes easier to interpret when users can see which equipment and process it belongs to.

Highlight unusual consumption patterns, inconsistent signals, missing data, or persistent deviations from expected operation.
Teams can investigate deviations before they become recurring cost, quality, comfort, or reliability issues.

Structured monitoring creates the trusted operational data required for benchmarking, reporting, predictive analysis, and AI-driven optimization. The same operational foundation also supports ISO 50001, ESG reporting, benchmarking, and continuous improvement initiatives.

Combine trends, KPI cards, system diagrams, status views, and comparisons in dashboards for operators, engineers, energy managers, and portfolio teams. Each role sees the level of detail required for its decisions while working from the same structured data foundation.
etalytics follows a structured three-step deployment model.

To reduce unnecessary energy use and operational risk.

Reduce troubleshooting time with complete operational context.

Replace repeated exports, spreadsheet checks, and disconnected dashboards with one structured view of current system behavior.

Operations, energy, facility, and sustainability teams work from the same data foundation instead of comparing separate reports and interpretations.

See which systems, utilities, and assets are monitored reliably and where missing data limits transparency.

Prepare your infrastructure for predictive analytics and autonomous optimization.
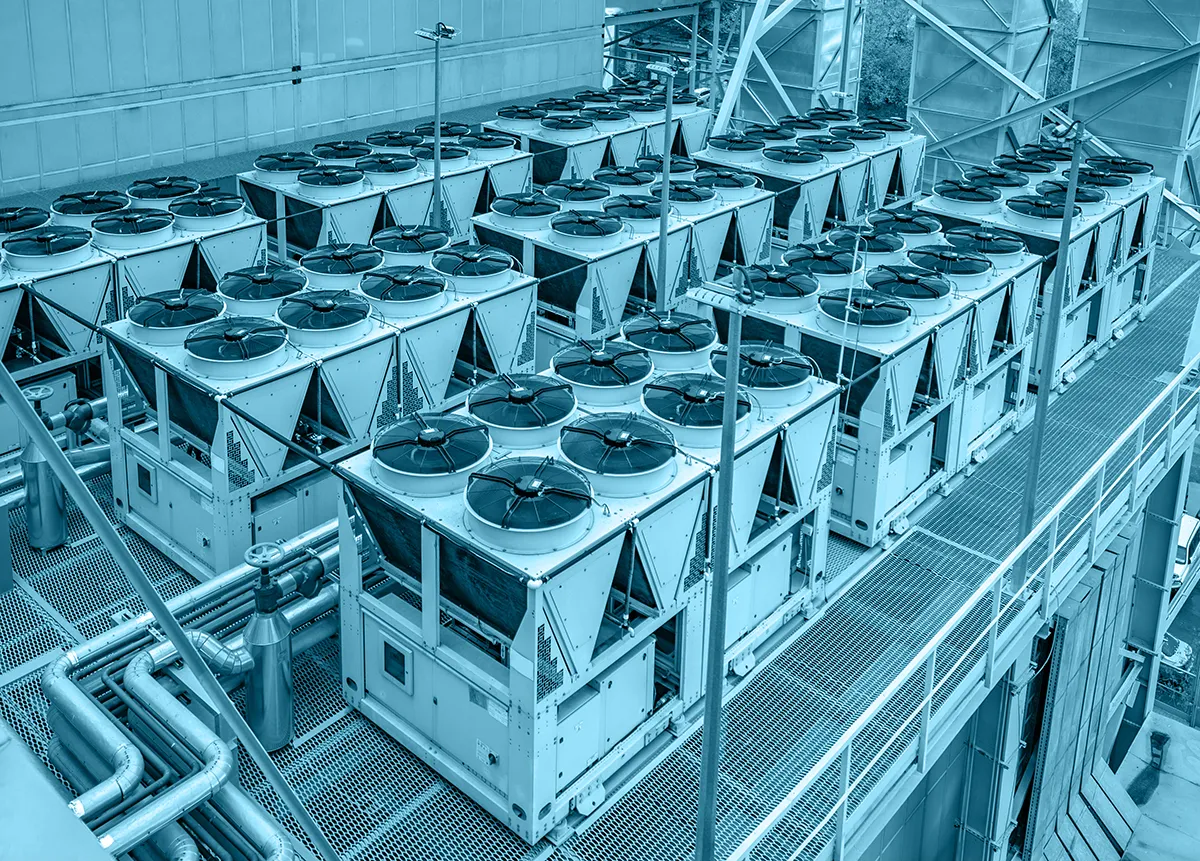
Optimize cooling plants, free cooling, hydraulic distribution, airflow-related dependencies, and supply temperatures while protecting mission-critical uptime and stability.
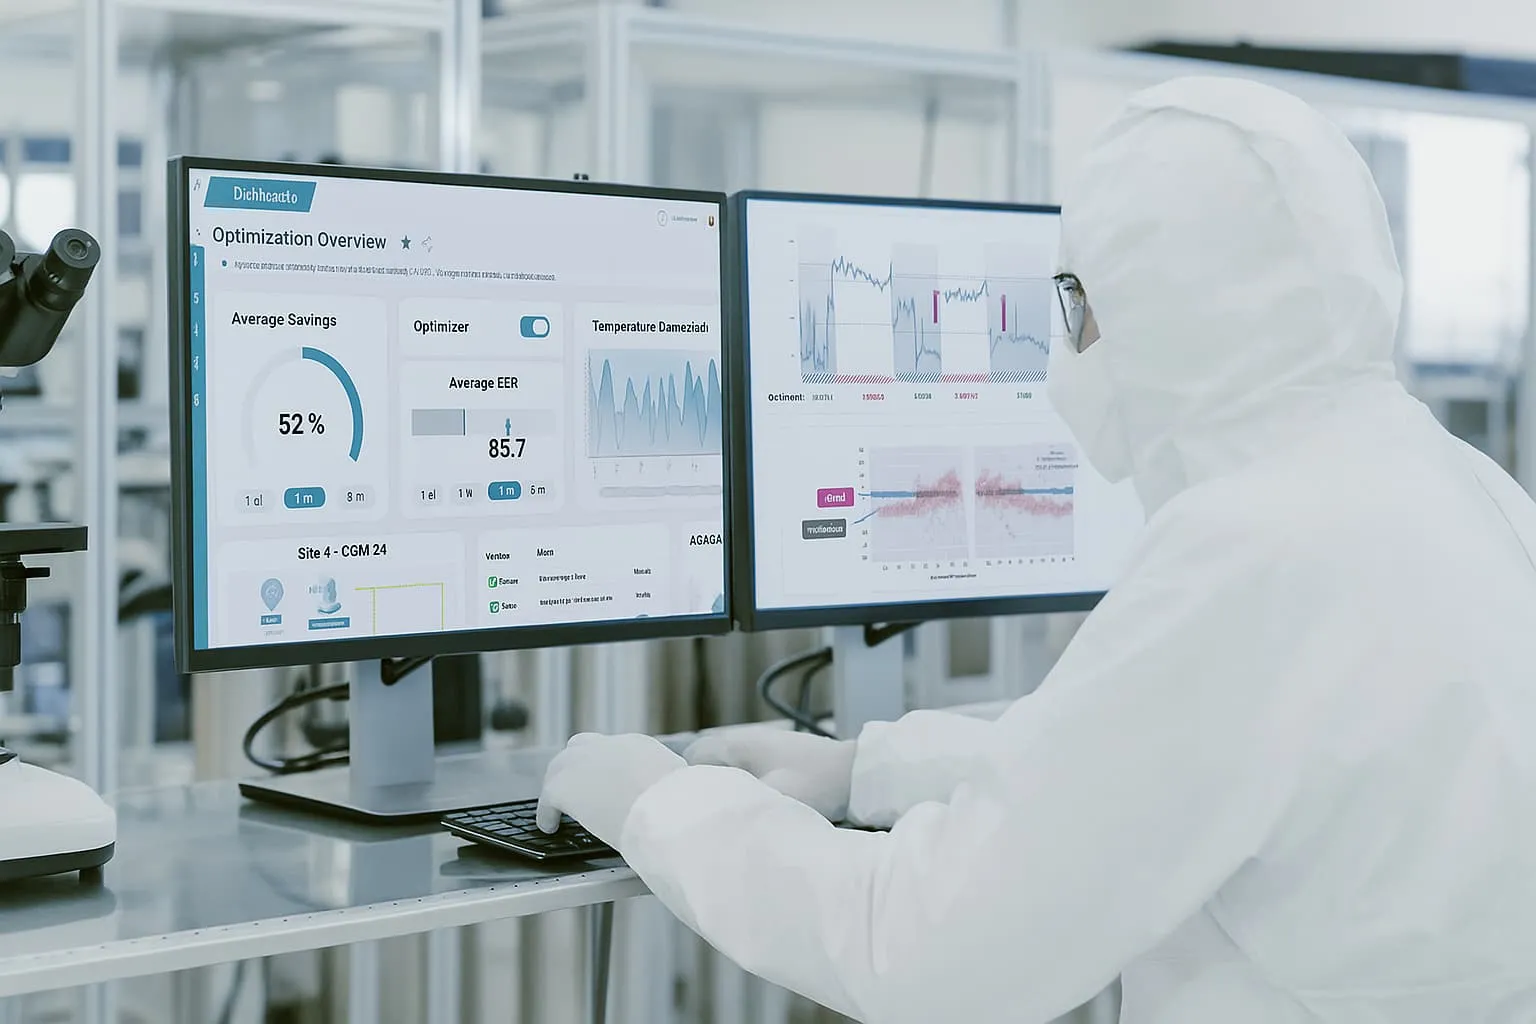
Improve HVAC and utility efficiency while maintaining stable environmental conditions, compliance requirements, and operational boundaries.

Reduce energy waste in process cooling, ventilation, heating, and site-level energy systems with variable production schedules and operating modes.

Coordinate cooling, heating, ventilation, thermal utilities, and electrical infrastructure under fluctuating production loads and changing energy prices.
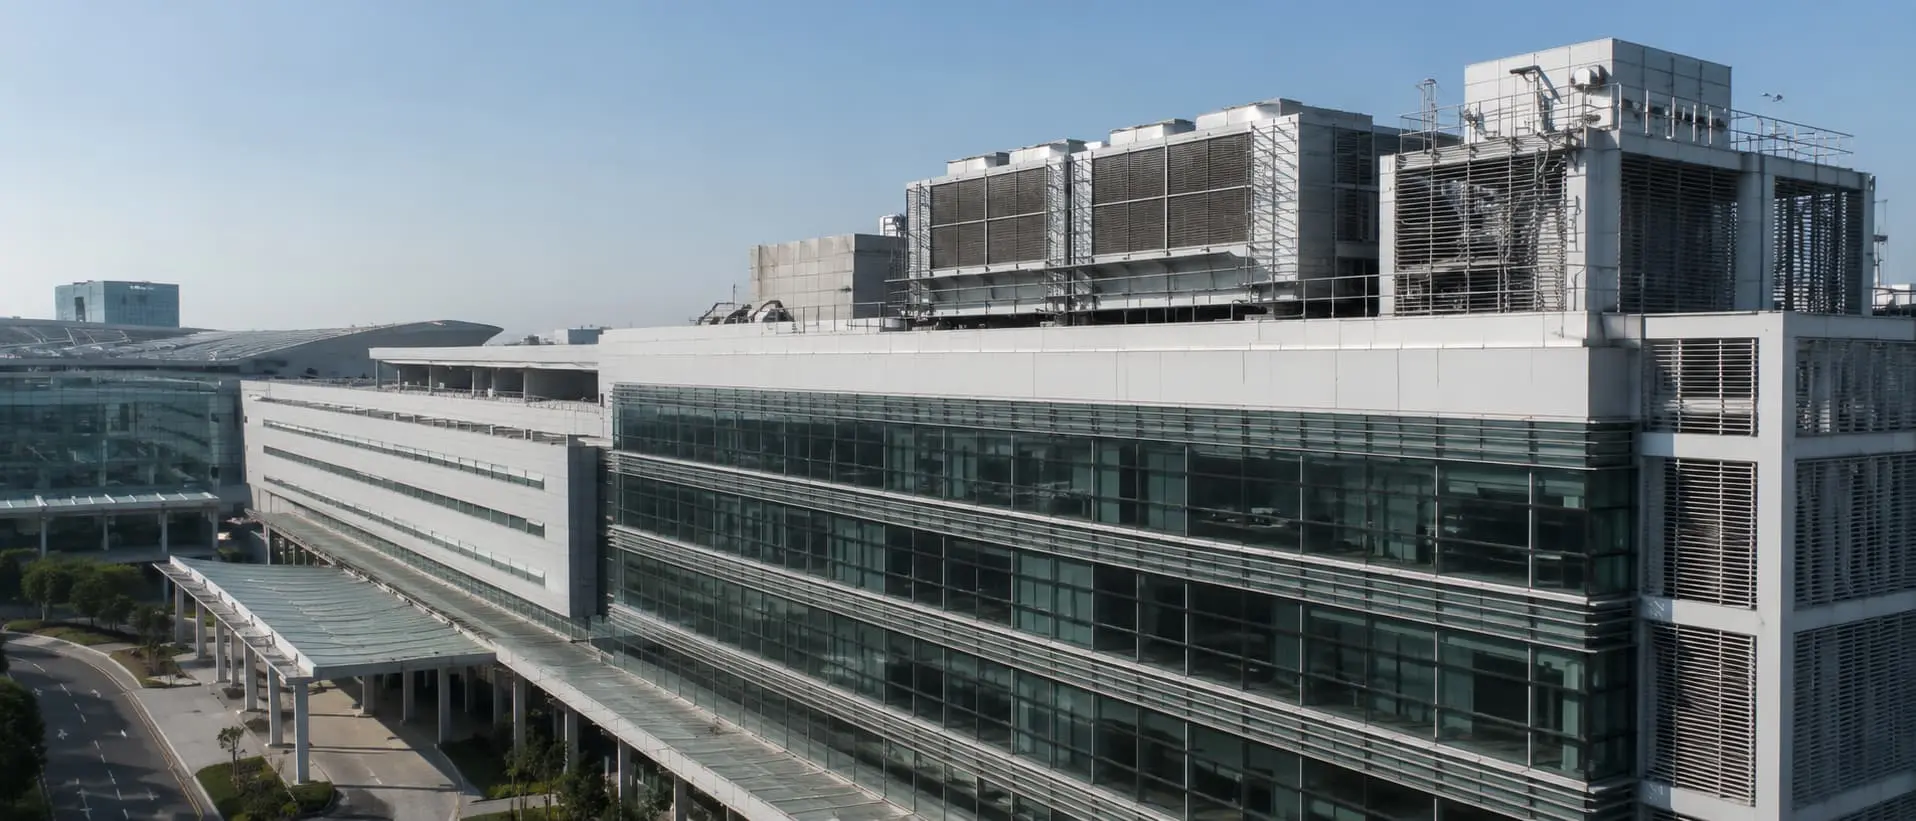
Improve performance in complex HVAC environments where demand, occupancy, weather, and operating schedules change continuously.
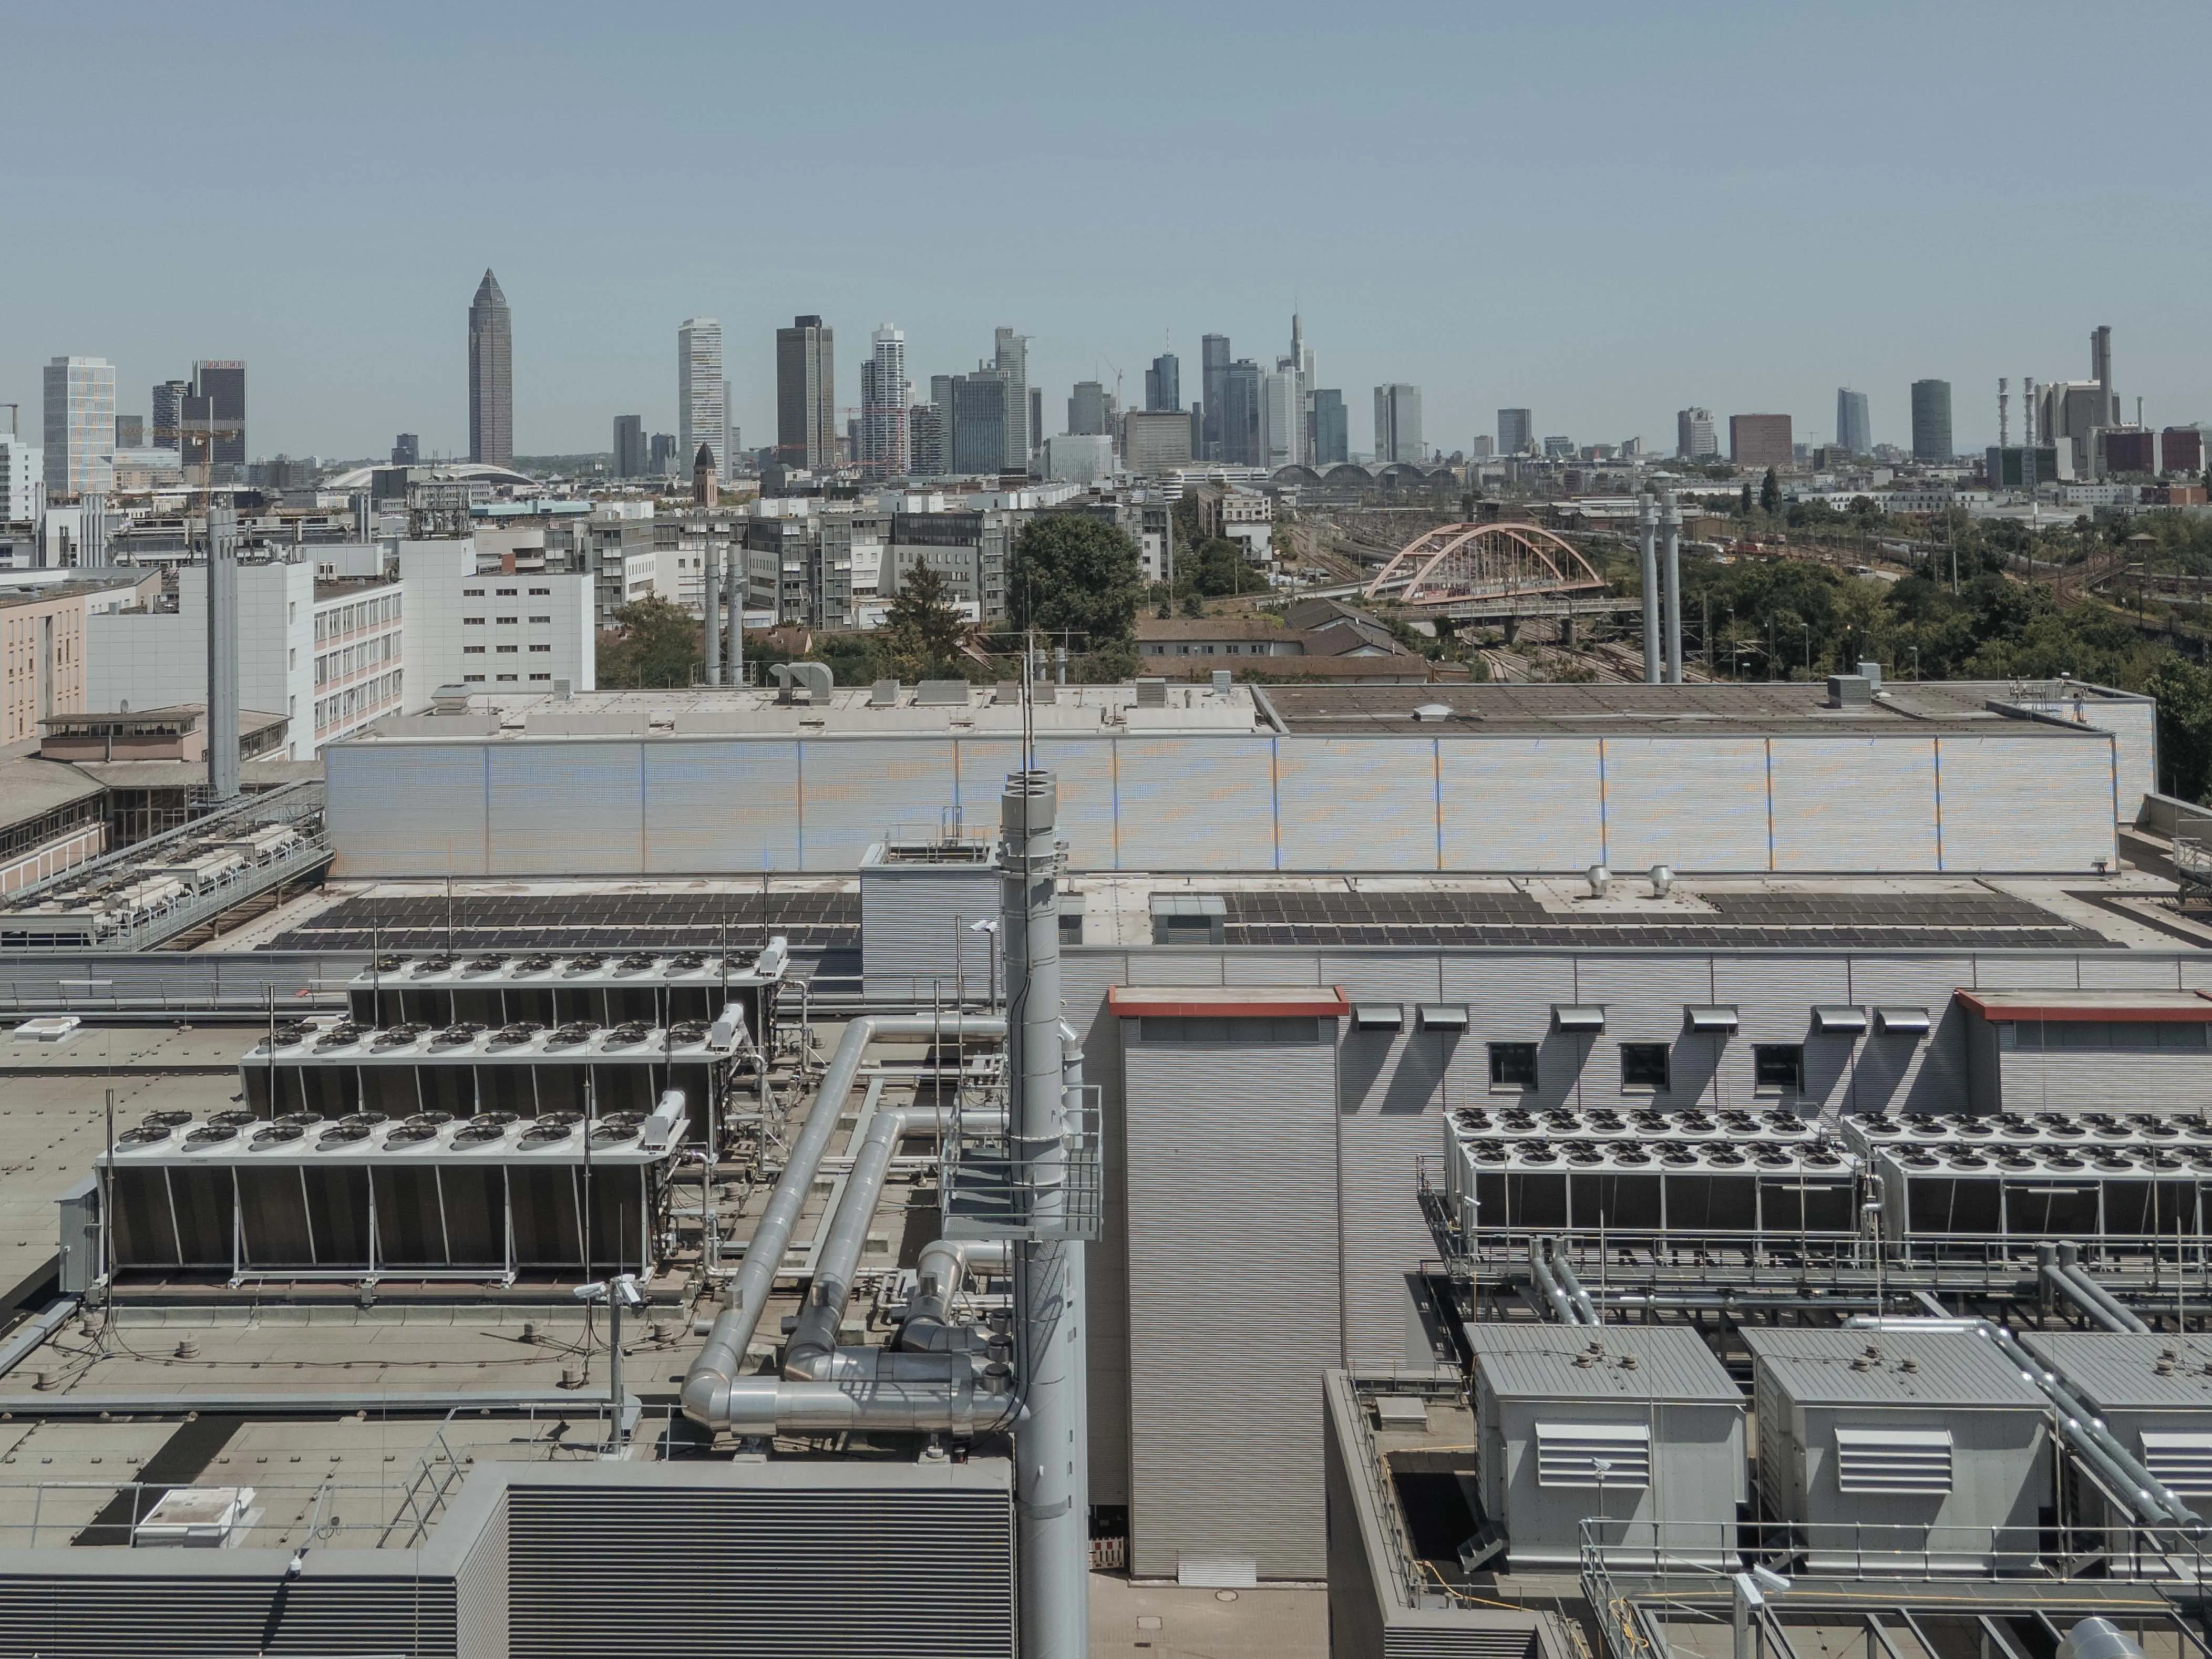
Equinix, Merck, and others achieve up to 50% cooling energy savings with etalytics. Explore our case studies.


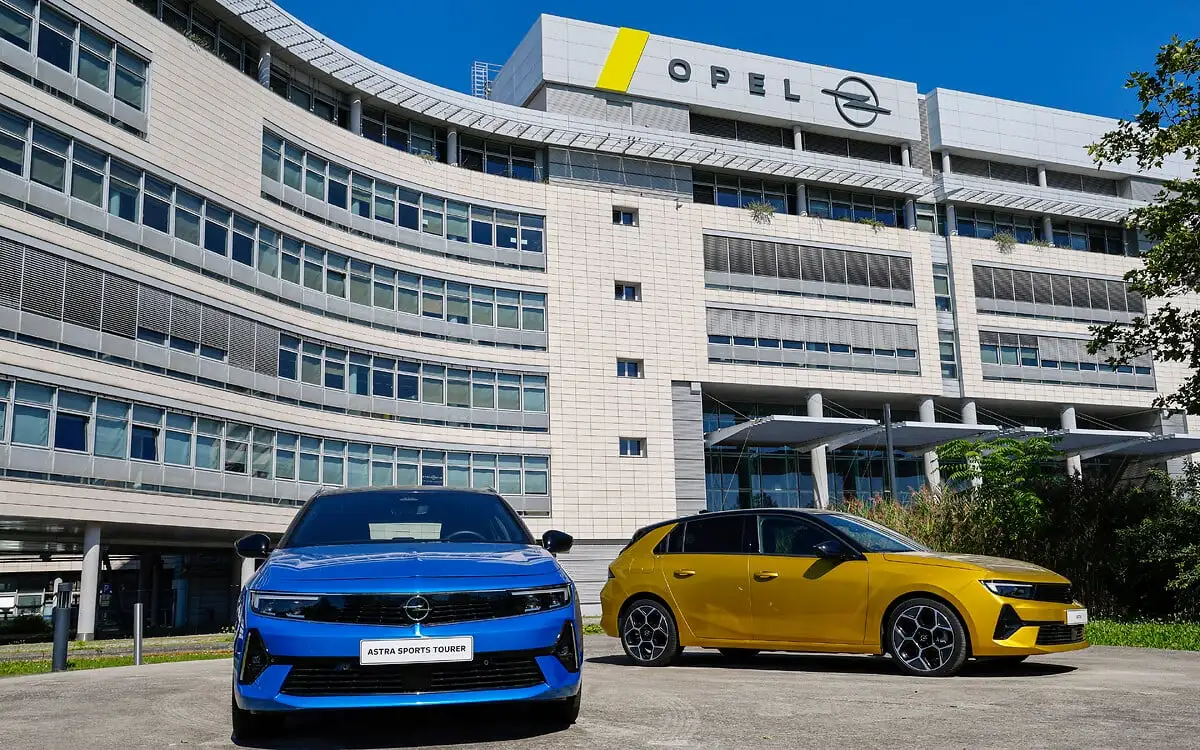
"With the help of etalytics' expertise, we are implementing AI-based operational optimization of the cooling systems at the Frankfurt site [...]. We are thus supporting a highly innovative approach that can serve as a blueprint for an entire industry."
Energy management starts with understanding how systems actually behave. A feasibility study identifies where real-time operational transparency can deliver the greatest value using your existing infrastructure.
Trusted by operators across data centers and industry




We empower industries to make complex energy systems and operations more intelligent, efficient, and resilient — with AI and digital twins that operators can trust.














.webp)