Book Demo
Book Demo

Standardize energy-performance indicators, compare like with like, and track when a site or asset moves away from its expected range. etaONE® connects every KPI to its boundary, calculation logic, operating context, and source data so technical and management teams can work from the same evidence.
Compare consistently: Use shared KPI definitions across sites and asset groups.
Account for operating conditions: Include relevant production, weather, load, utilization, or operating modes.
Investigate performance gaps: Move from portfolio-level comparisons to the underlying system and source signals.












Many organizations already calculate energy-performance indicators. The challenge is that sites and teams often use different system boundaries, formulas, time periods, units, and normalization methods. This creates rankings and reports that look precise but do not always support a fair technical comparison.
Without a consistent methodology, benchmarking can direct attention toward the wrong site or asset. Genuine performance gaps remain hidden, while normal operational differences may be treated as inefficiencies.


etaONE® helps teams define how energy performance should be calculated, compared, and reviewed. KPIs are connected to their system boundaries, source data, operating conditions, and calculation logic.

Define common formulas, units, aggregation periods, system boundaries, and data-quality rules.
Teams can confirm that an indicator such as kWh per unit, kWh per runtime hour, or cooling efficiency is calculated consistently across the comparison.

Compare current energy performance against approved baselines, targets, or expected operating ranges.
This gives teams a documented point of comparison instead of relying on informal assumptions.

Include variables such as production volume, ambient temperature, system load, utilization, runtime, or operating mode where they materially affect consumption.
This helps distinguish justified variation from genuine underperformance.

Group comparable sites, systems, or asset types using defined inclusion criteria.
Comparable entities can be ranked together,while fundamentally different systems remain separate.

Monitor whether an asset or site moves awayfrom its baseline, peer range, or expected operating band.
Persistent deviations become easier to identify before they are hidden inside quarterly or annual averages.

Link KPI changes to the contributing timeseries, operating states, and asset context.
Technical teams can investigate why performance changed without rebuilding the calculation manually.
etalytics follows a structured three-step deployment model.

Use consistent boundaries, formulas, units, and peer-group criteria to create fair comparisons across sites, systems, and assets.
Identify when efficiency gradually moves away from an approved baseline, target, or expected operating range.

Prioritize persistent and operationally relevant performance differences instead of treating every short-term fluctuation as a problem.

Move from a portfolio ranking or KPI deviation to the asset data, operating conditions, and source signals behind it.

Give site and corporate teams a shared set of indicators for recurring energy-performance discussions.

Use traceable benchmarks to select improvement measures, review their effect, and identify where further technical analysis is needed.
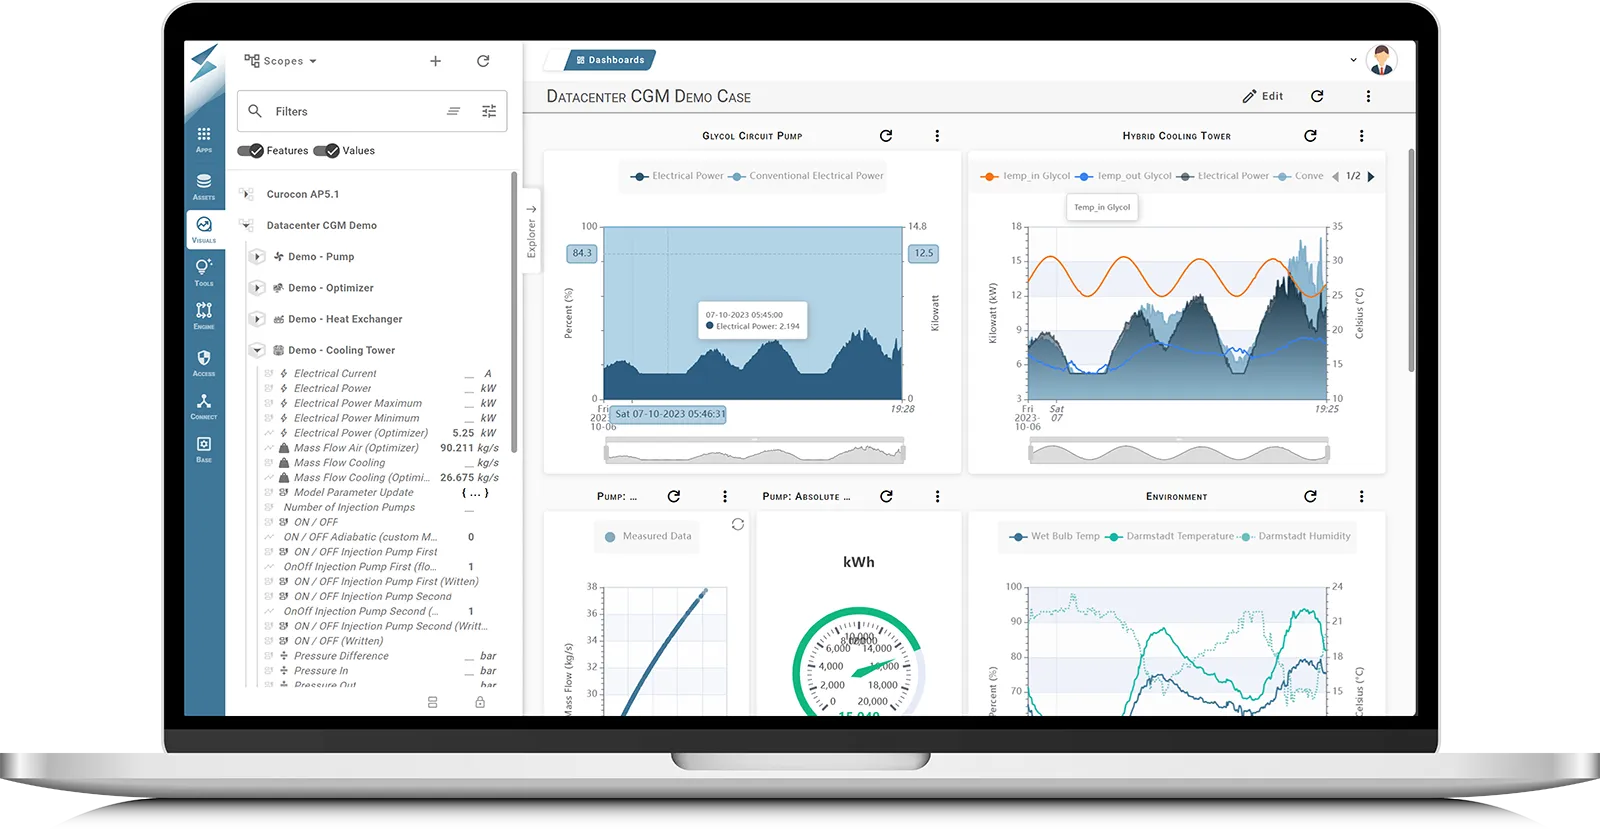
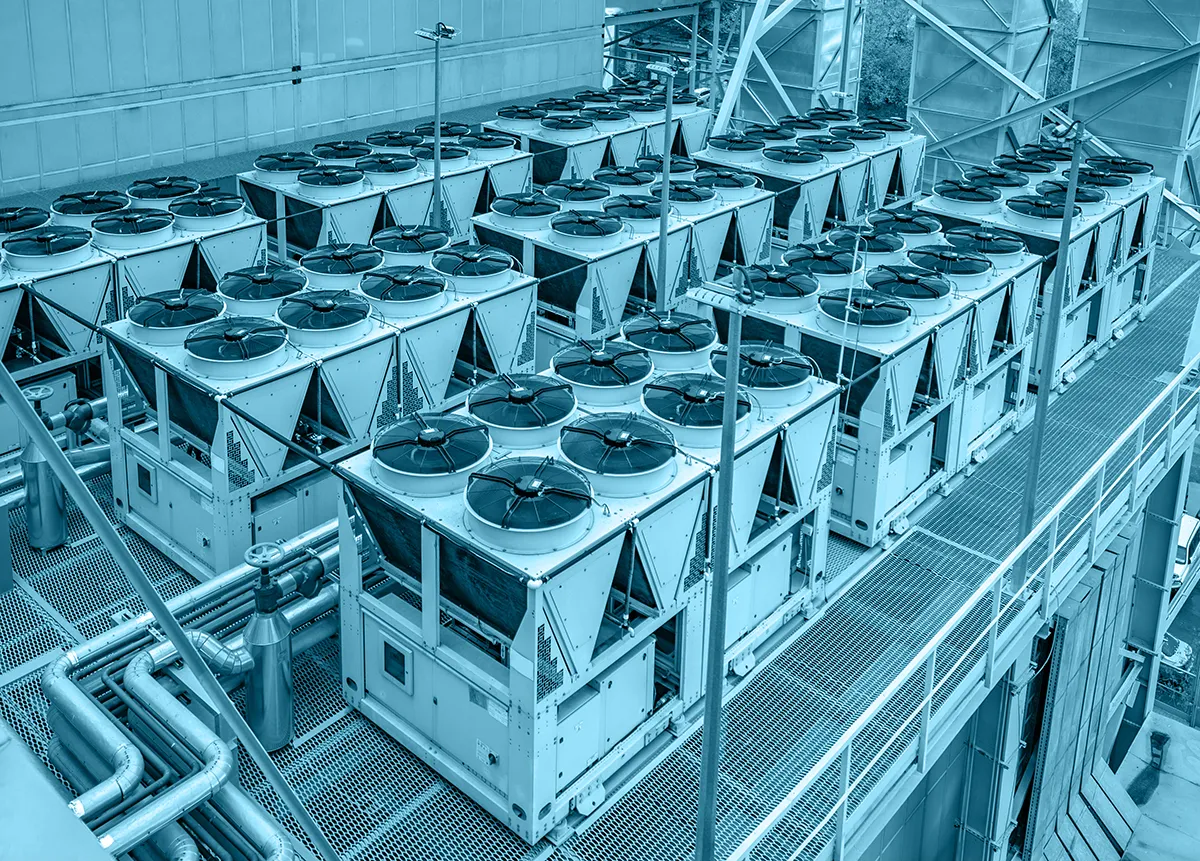
Optimize cooling plants, free cooling, hydraulic distribution, airflow-related dependencies, and supply temperatures while protecting mission-critical uptime and stability.
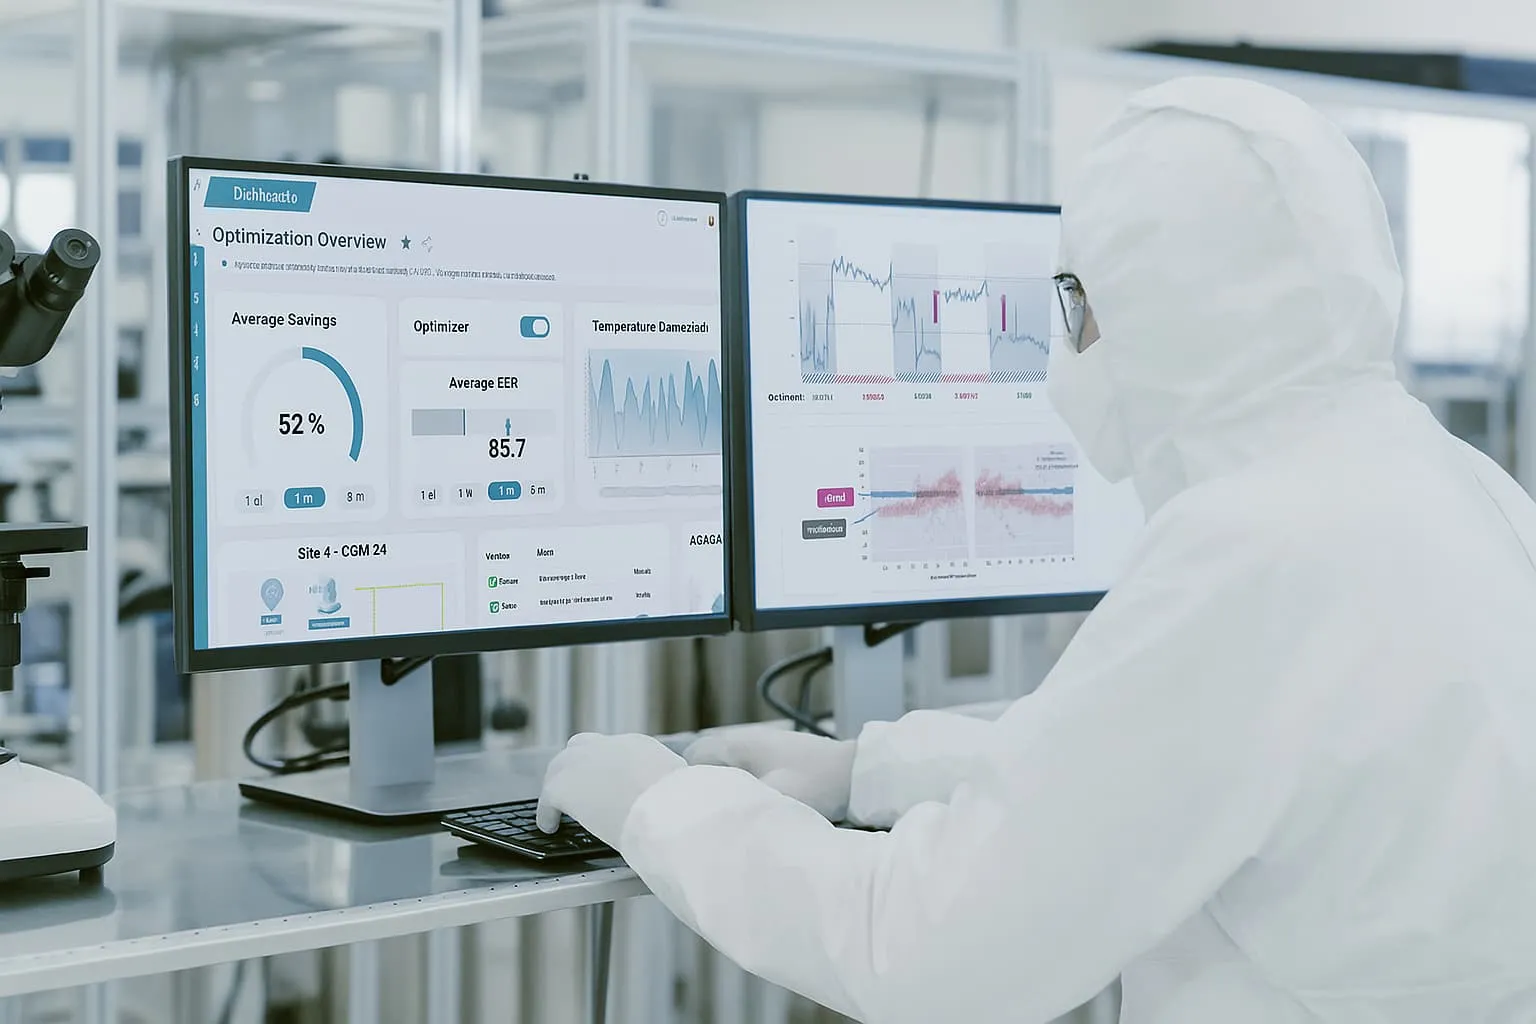
Improve HVAC and utility efficiency while maintaining stable environmental conditions, compliance requirements, and operational boundaries.

Reduce energy waste in process cooling, ventilation, heating, and site-level energy systems with variable production schedules and operating modes.

Coordinate cooling, heating, ventilation, thermal utilities, and electrical infrastructure under fluctuating production loads and changing energy prices.
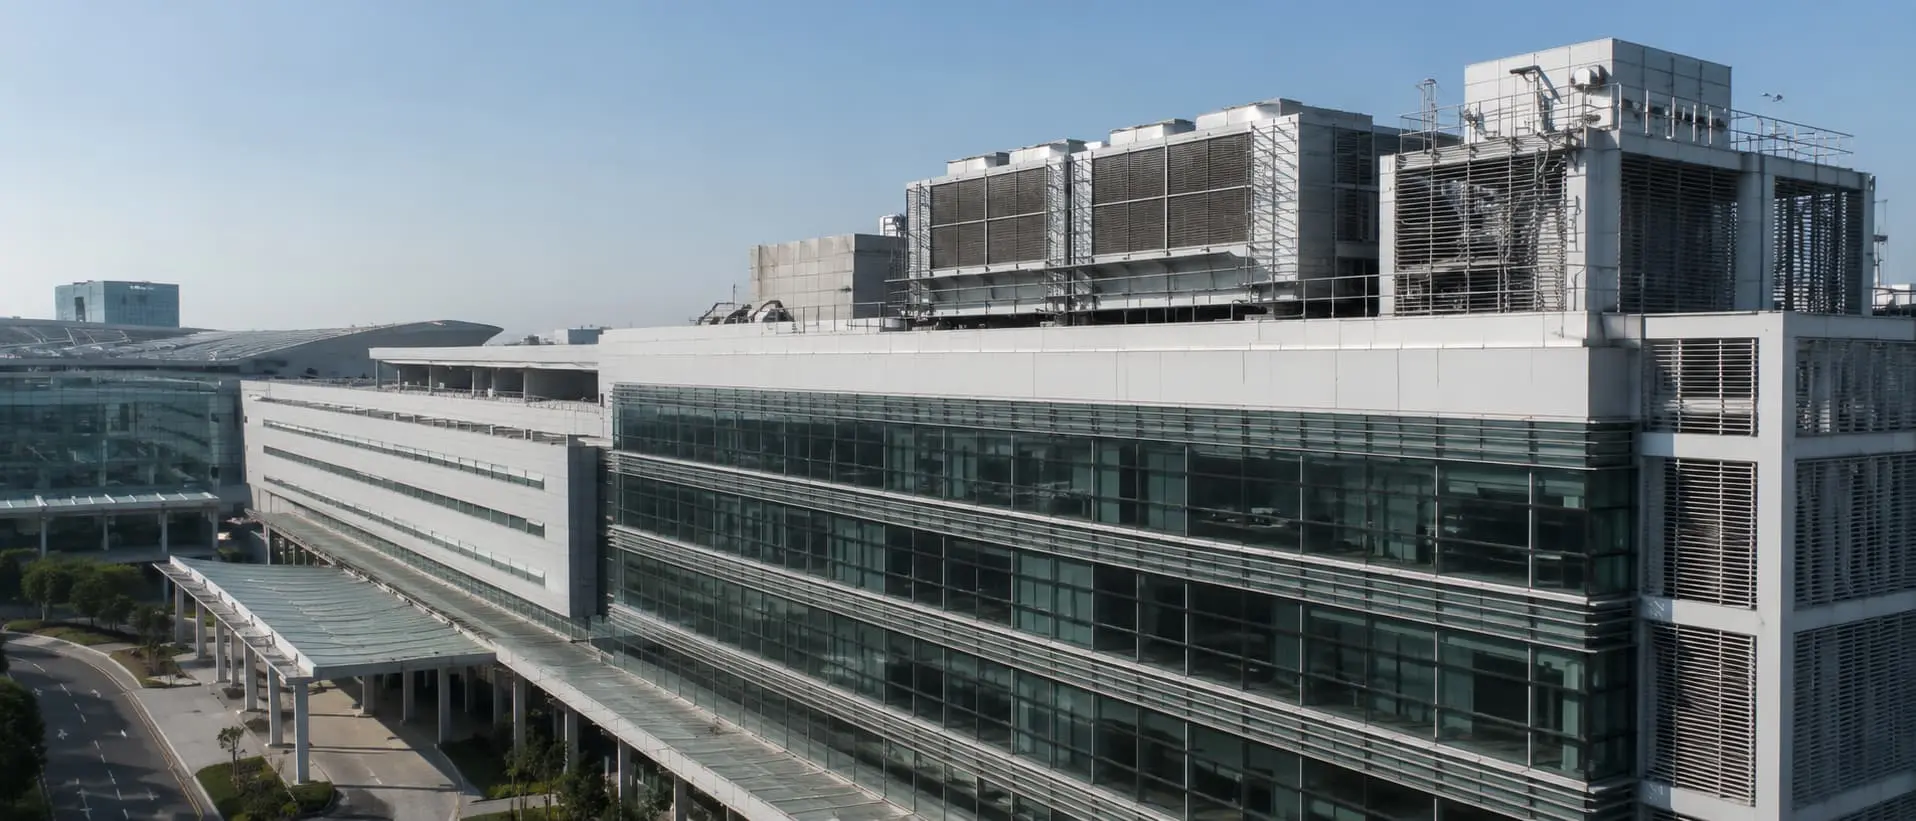
Improve performance in complex HVAC environments where demand, occupancy, weather, and operating schedules change continuously.
Equinix, Merck, and others achieve up to 50% cooling energy savings with etalytics. Explore our case studies.
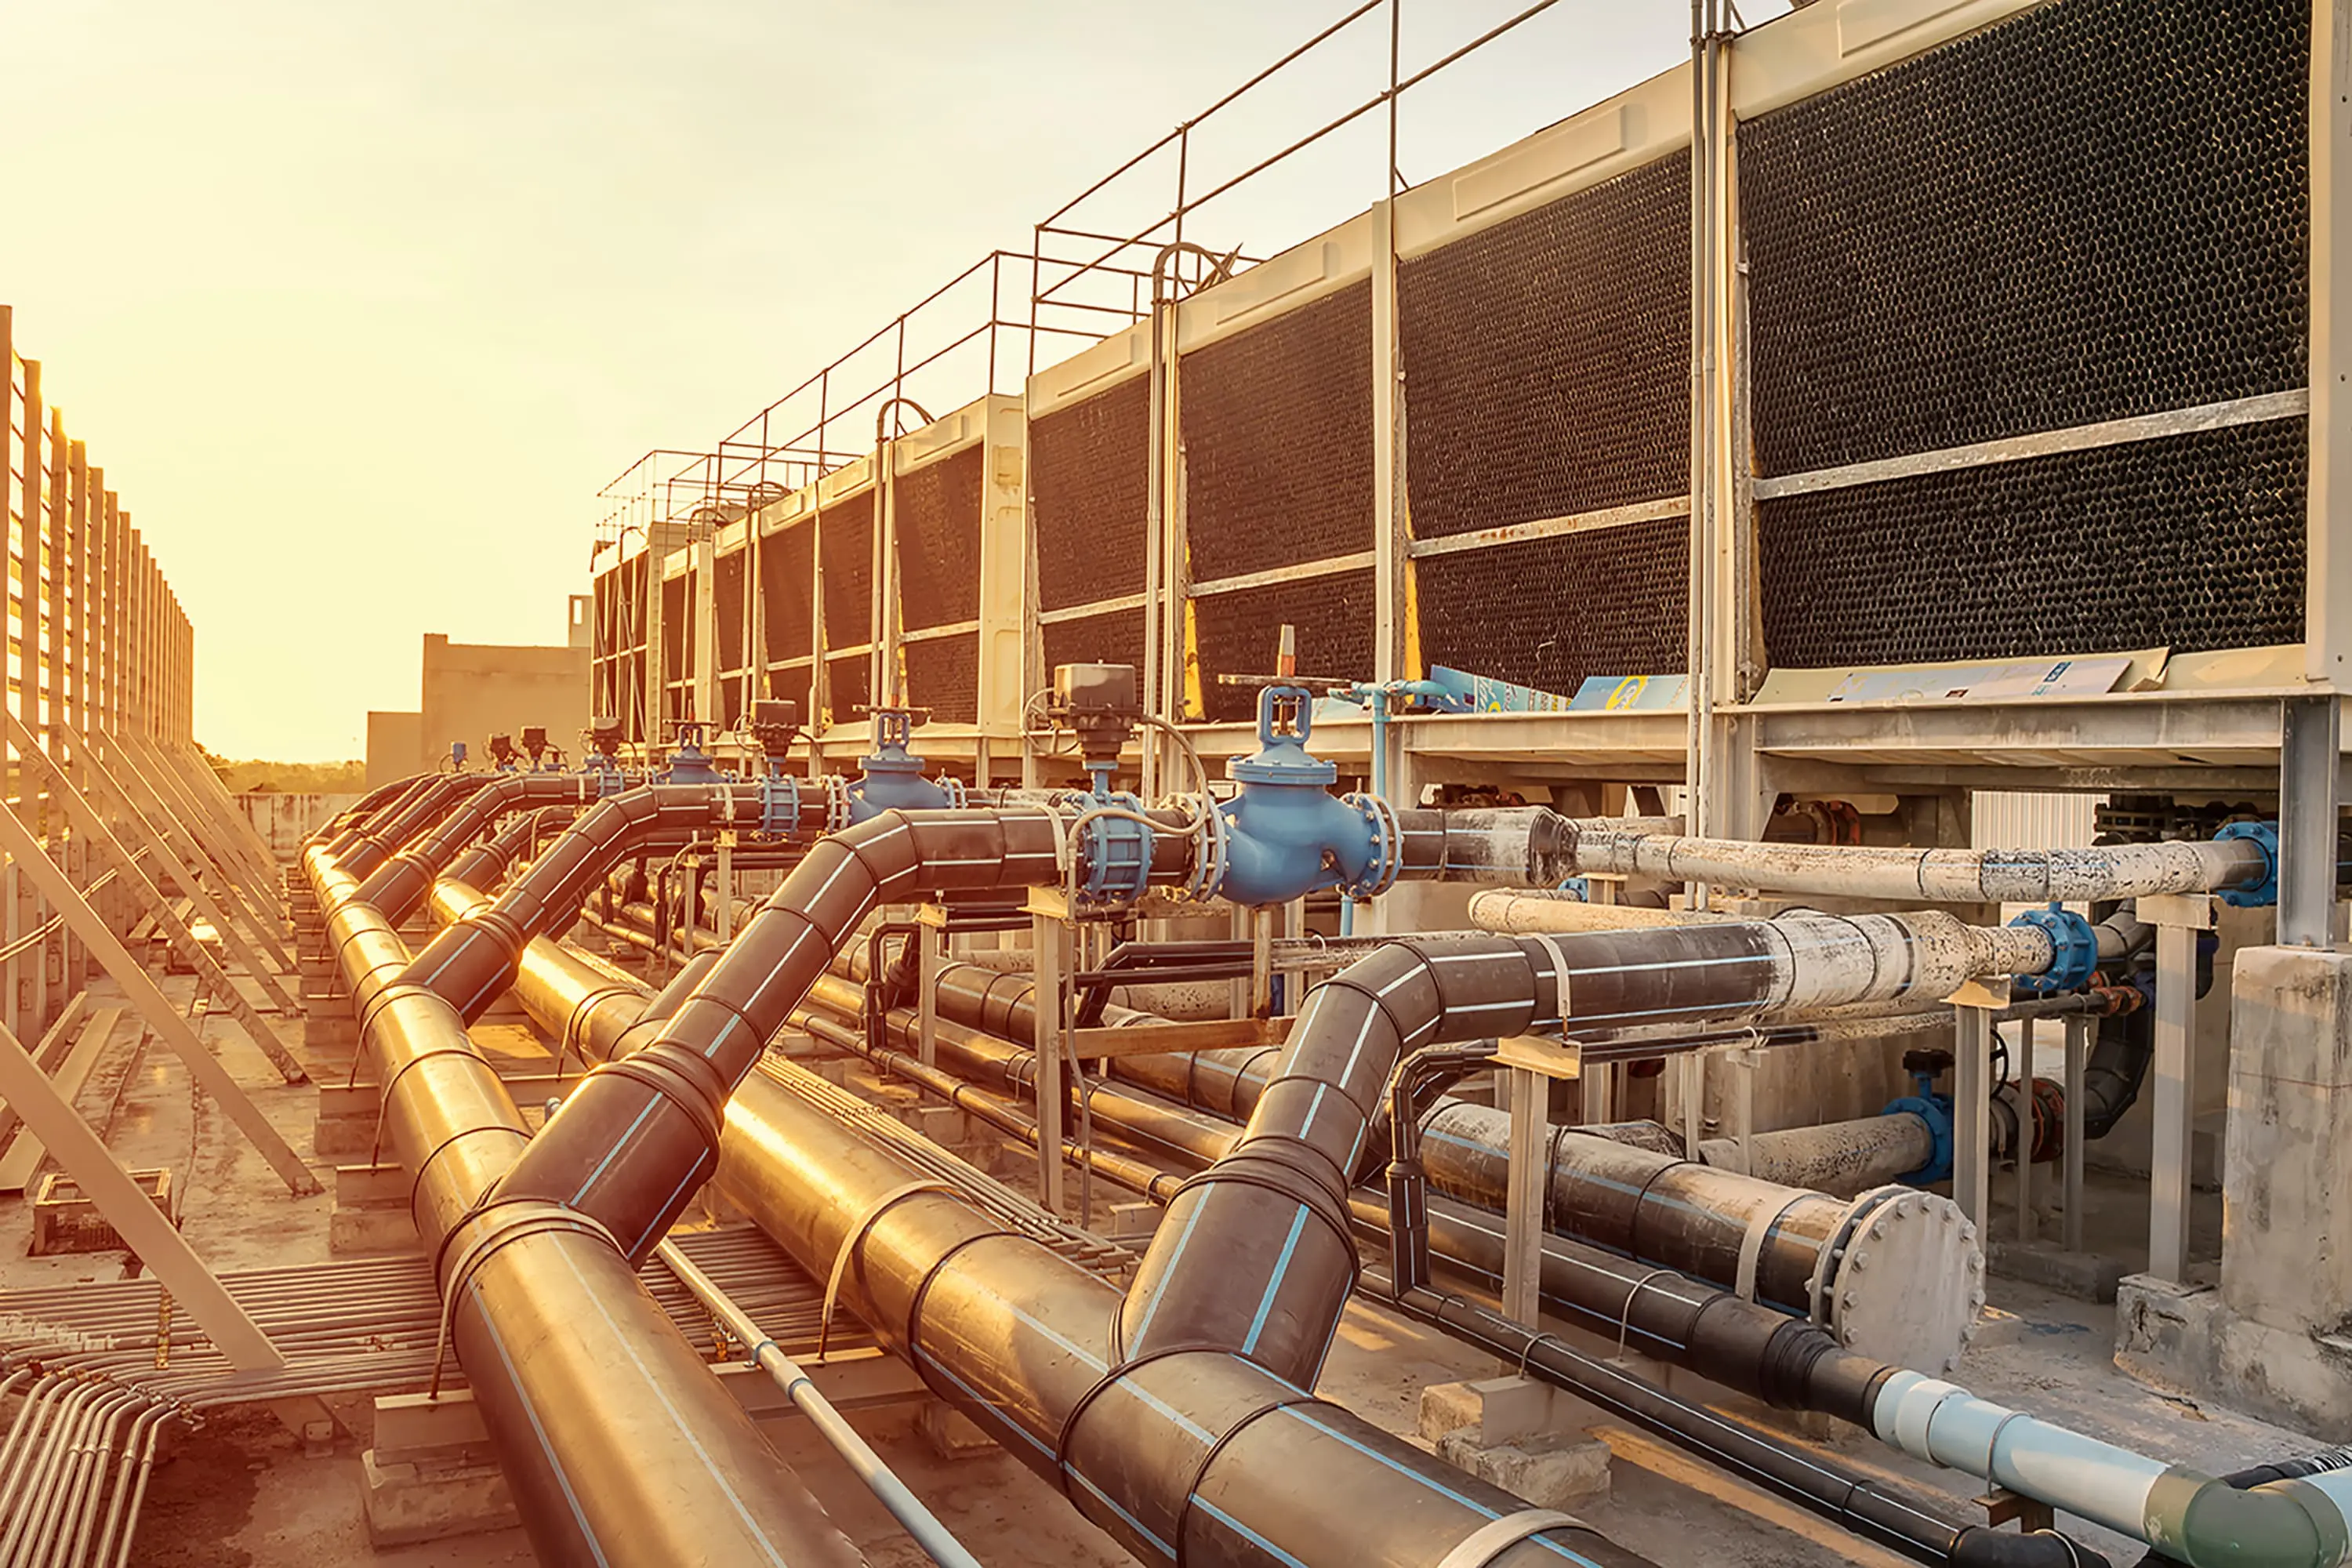

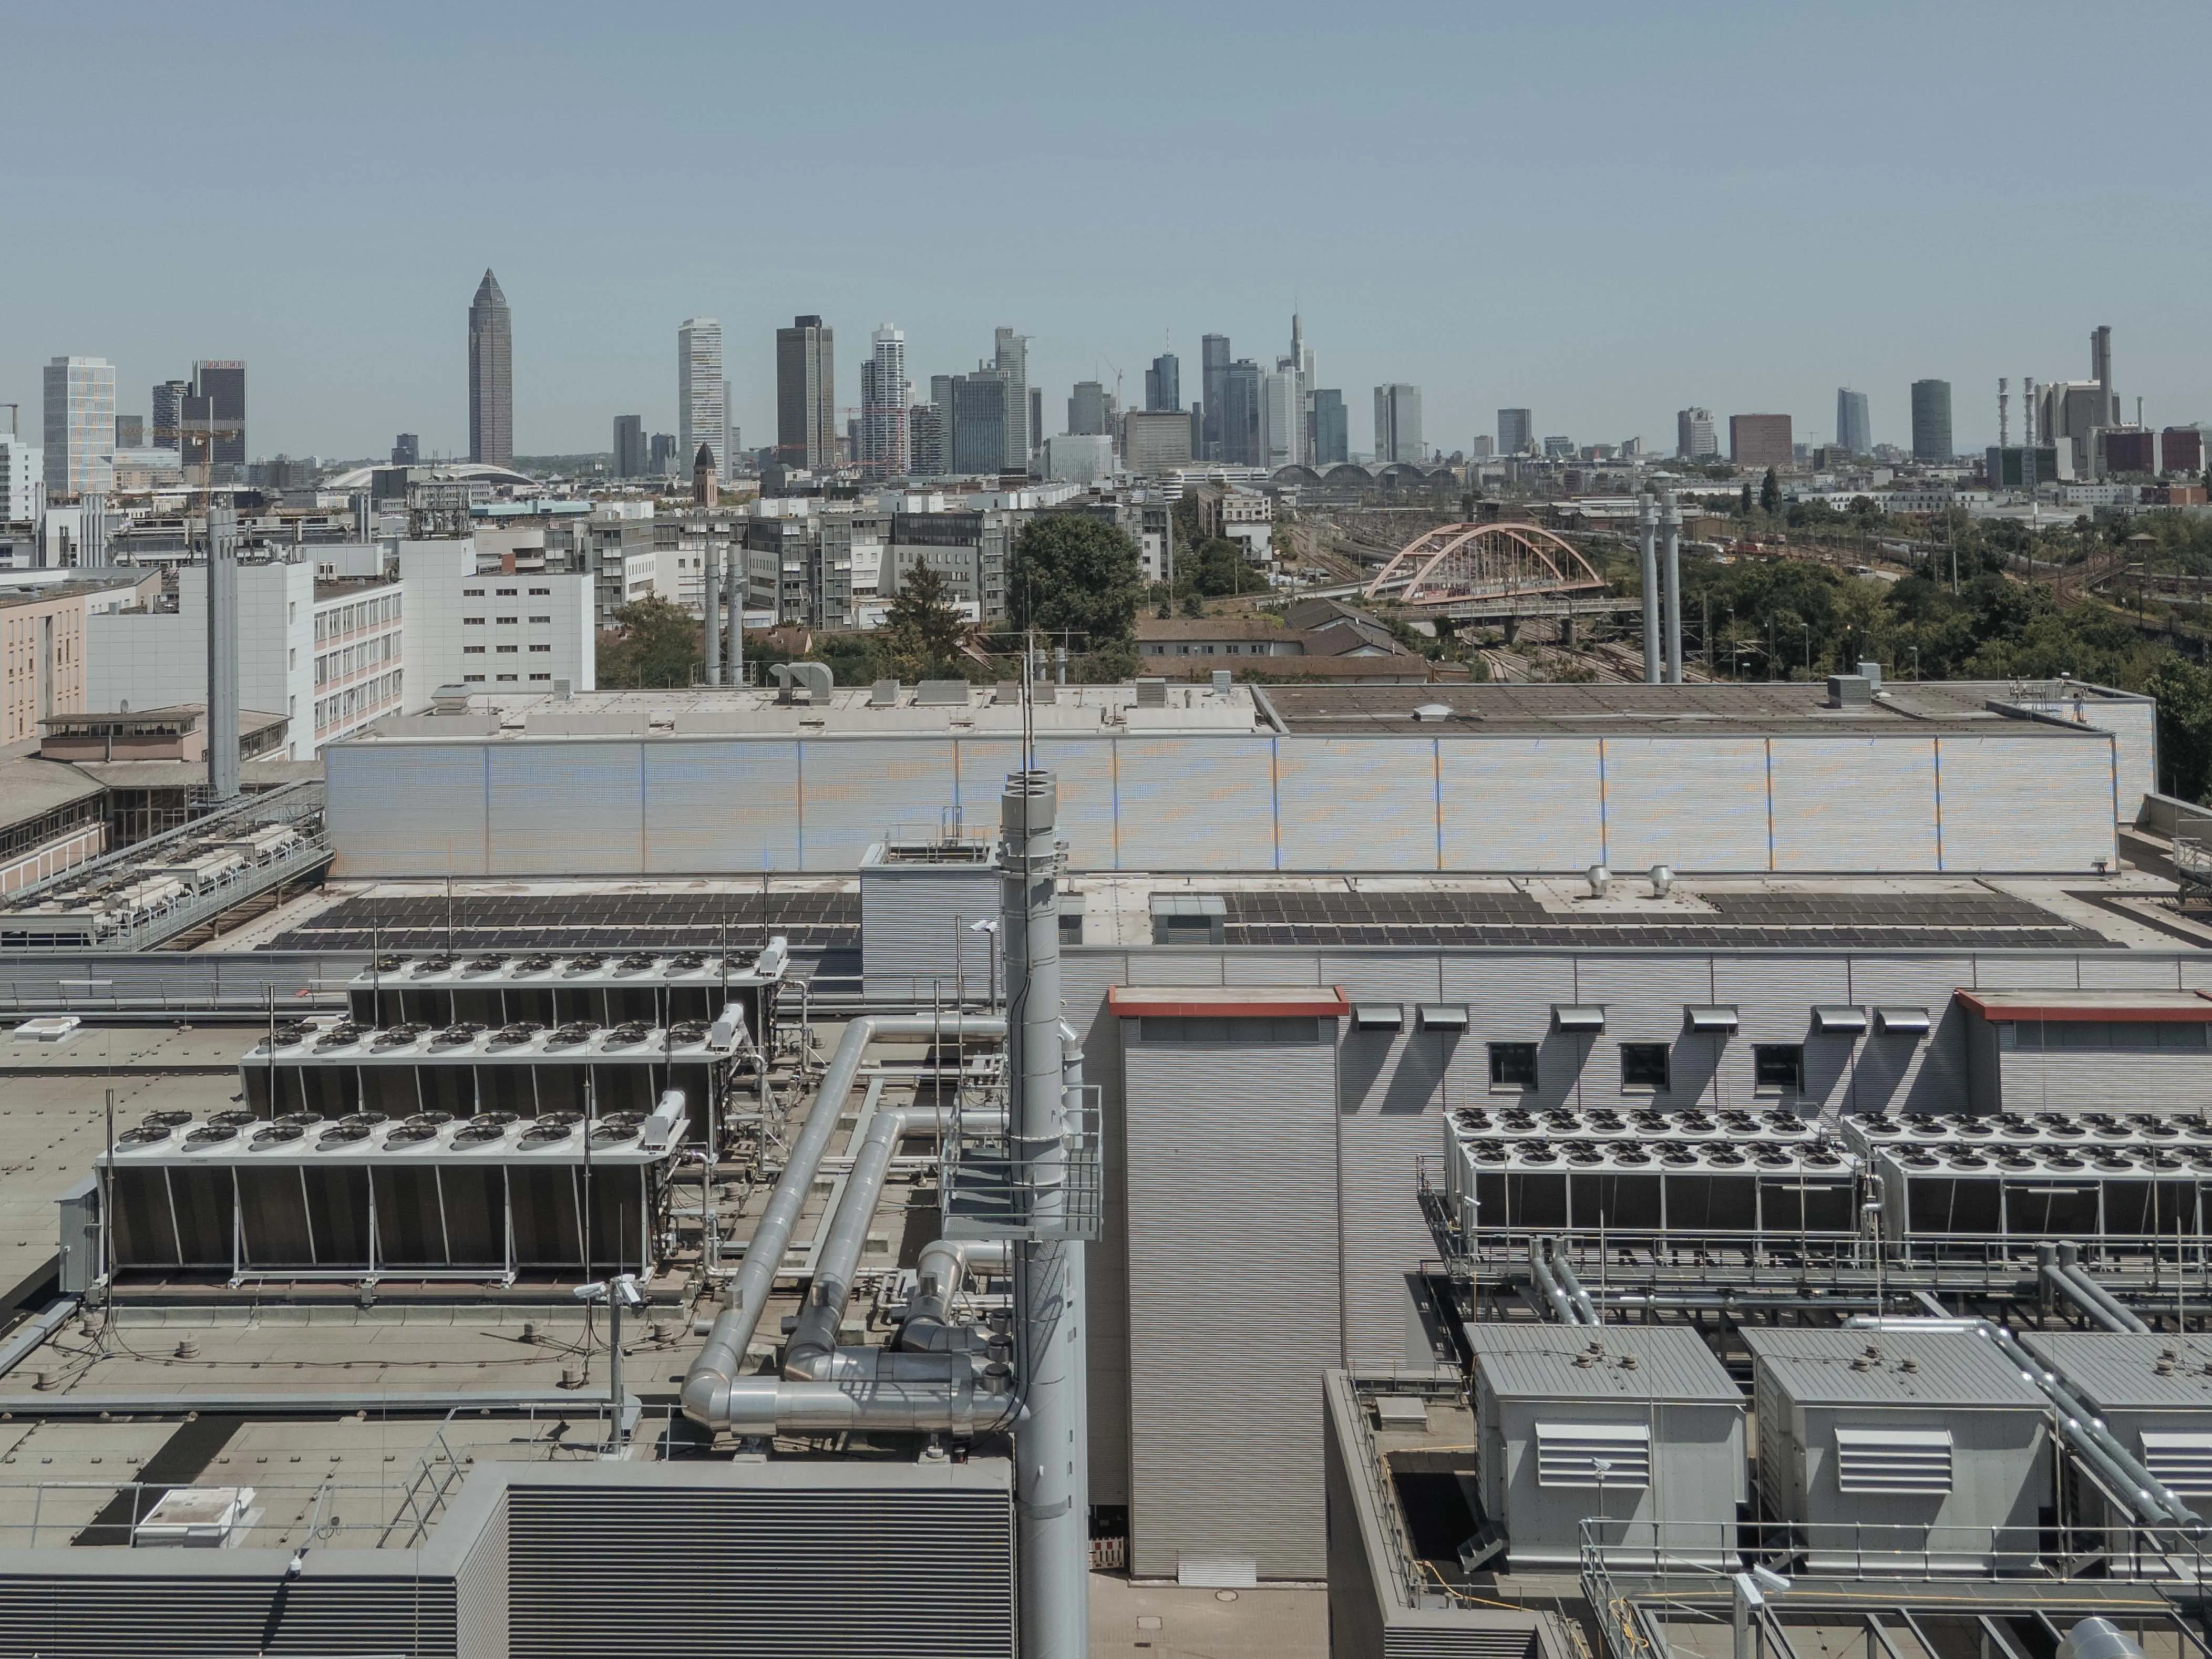
"With the help of etalytics' expertise, we are implementing AI-based operational optimization of the cooling systems at the Frankfurt site [...]. We are thus supporting a highly innovative approach that can serve as a blueprint for an entire industry."
Benchmarking is the next step after energy transparency. Once teams trust their data and compare performance consistently, they can identify inefficiencies, anticipate degradation, and prioritize optimization efforts.
Trusted by operators across data centers and industry





We empower industries to make complex energy systems and operations more intelligent, efficient, and resilient — with AI and digital twins that operators can trust.
















.webp)