Book Demo
Book Demo

Connect operational energy data with approved metadata, boundaries, and calculation logic. etaONE® helps teams prepare recurring energy-performance evidence for ISO 50001 and ESG workflows, generate scheduled reports, and hand over traceable datasets without rebuilding the same spreadsheet process every reporting period.
Reuse approved energy data and KPI calculations across reporting periods.
Trace reported values back to their source, scope, and methodology
Identify gaps and inconsistencies before data is handed over.












Most organizations already collect the data needed for energy-management and sustainability reporting. The challenge is preparing it consistently.
Every reporting cycle often repeats the same manual work: exporting data, aligning units, checking gaps, rebuilding formulas, validating boundaries, and explaining the final numbers.
Manual workflows consume scarce expert time and increase the risk of inconsistent evidence, late corrections, and repeated assurance questions.


etaONE® structures energy data around the systems, assets, sites, and reporting boundaries behind it. Reusable calculations, data-quality checks, dashboards, and exports reduce repetitive preparation while keeping responsibilities and assumptions visible.

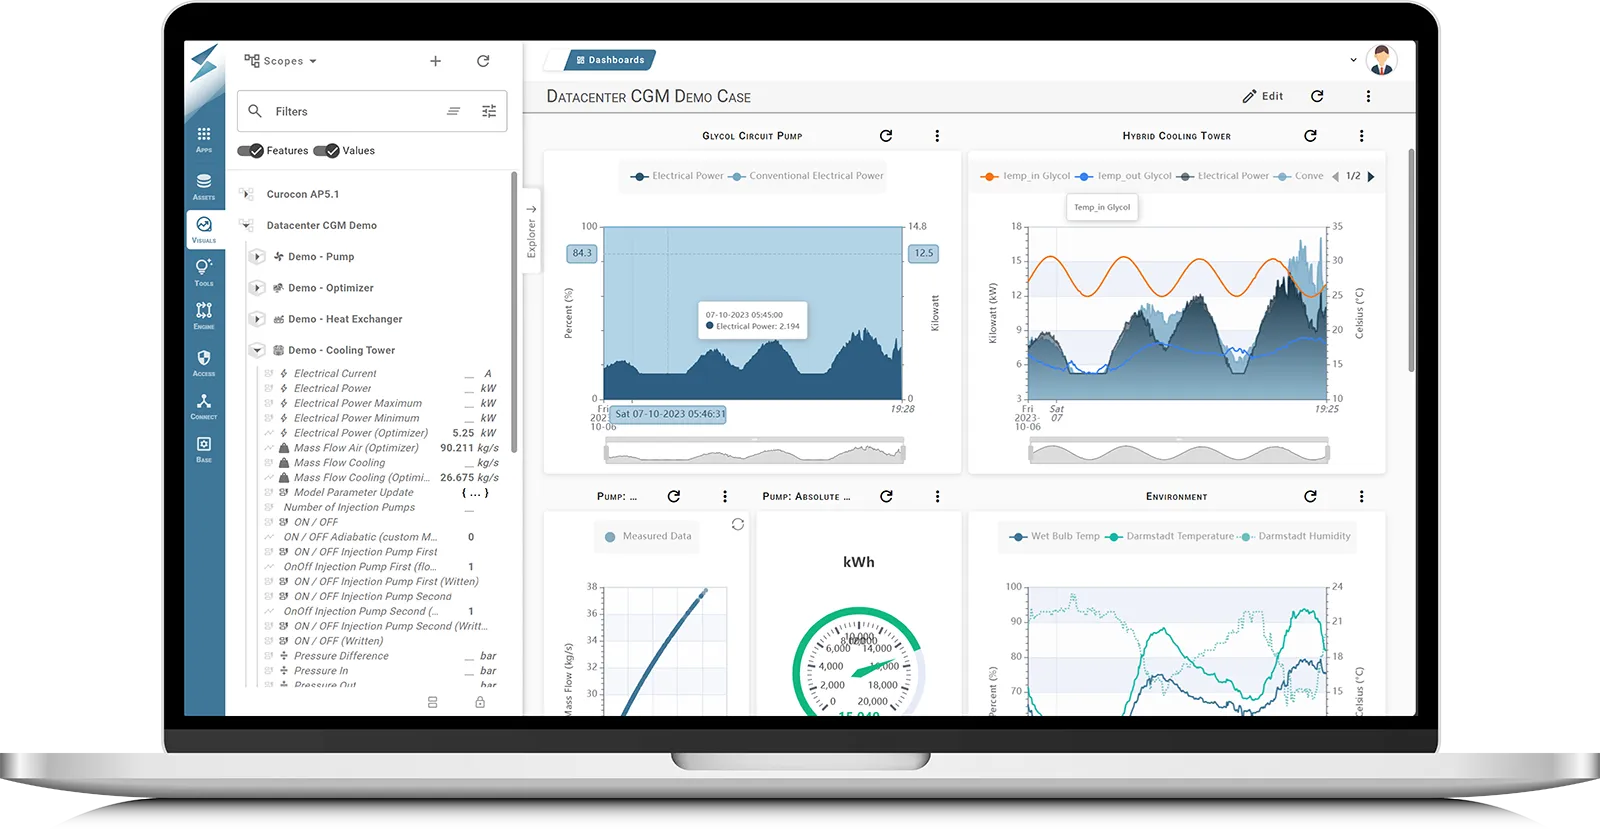
Retrieve relevant time series from available meters, BMS, SCADA, PLCs, historians, APIs, and files using configured connections.
Reporting can begin from the operational source instead of a chain of copied spreadsheets.

Map signals to sites, systems, assets, utilities, units, organizational scopes, and reporting periods.
A reported value retains the context needed to understand what is included and excluded.

Apply configured calculations for energy-performance indicators, aggregations, normalization, and baseline comparisons.
Teams reduce repeated formula work and keep approved logic consistent across reporting periods.

Use configured checks to surface gaps, duplicates, inconsistent units, unusual ranges, or other defined conditions.
Potential reporting issues can be reviewed before the output is distributed.

Turn approved dashboards or report views into recurring PDFs or structured data exports.
Teams can generate consistent outputs without recreating the layout and dataset each time.

Retain the relationship between source data, transformations, reporting scopes, and final outputs.
Energy and sustainability teams can discuss the same number with a clearer evidence trail.
etalytics follows a structured three-step deployment model.

Reduce the time spent collecting, aligning, and formatting the same energy data for every reporting period.

Reduce the number of local files, exports, copy-paste steps, and spreadsheet handoffs.
Surface missing intervals, inconsistent units, and incomplete metadata before they delay a report or create correction loops.

Connect reported values with the underlying data, system boundary, calculation method, and reporting period.

Use reviewed data and transformations across management reports and downstream ESG workflows.

Reduce clarification and correction loops between technical, finance, and sustainability teams.
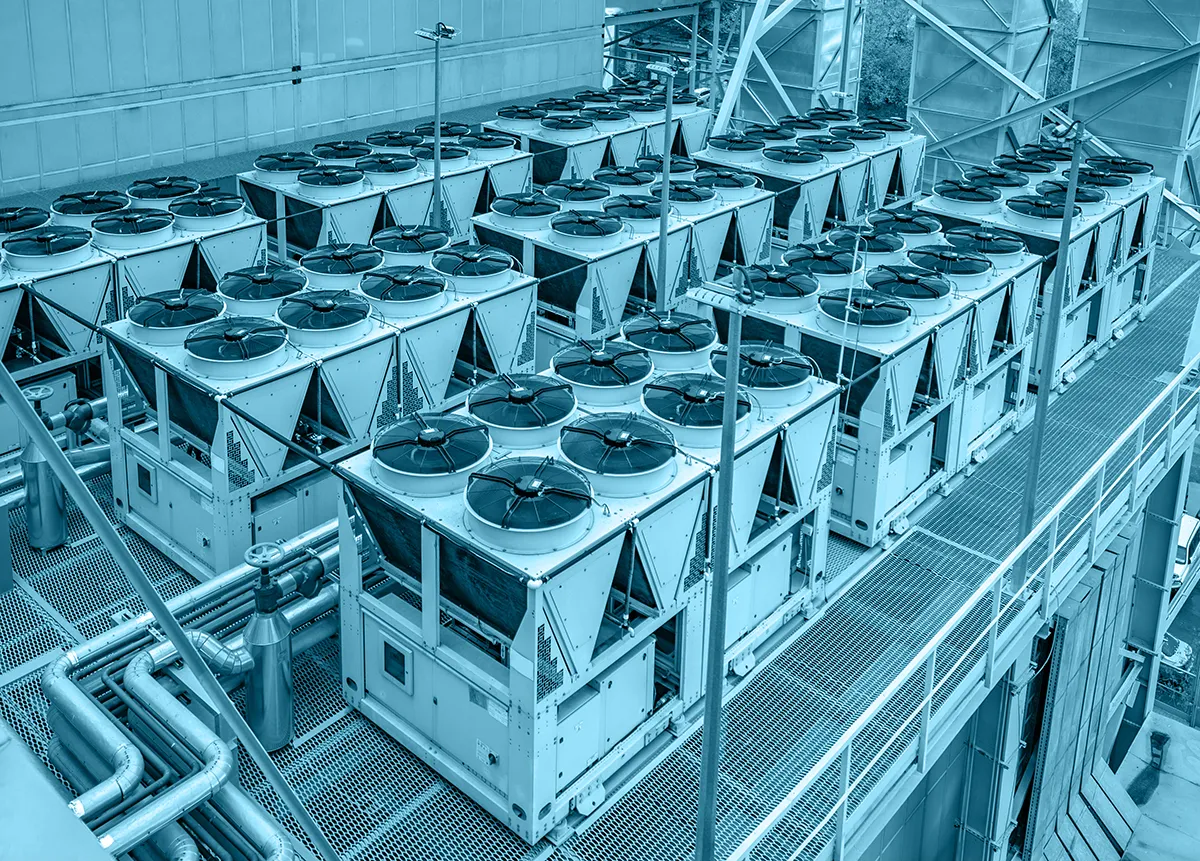
Optimize cooling plants, free cooling, hydraulic distribution, airflow-related dependencies, and supply temperatures while protecting mission-critical uptime and stability.

Reduce energy waste in process cooling, ventilation, heating, and site-level energy systems with variable production schedules and operating modes.
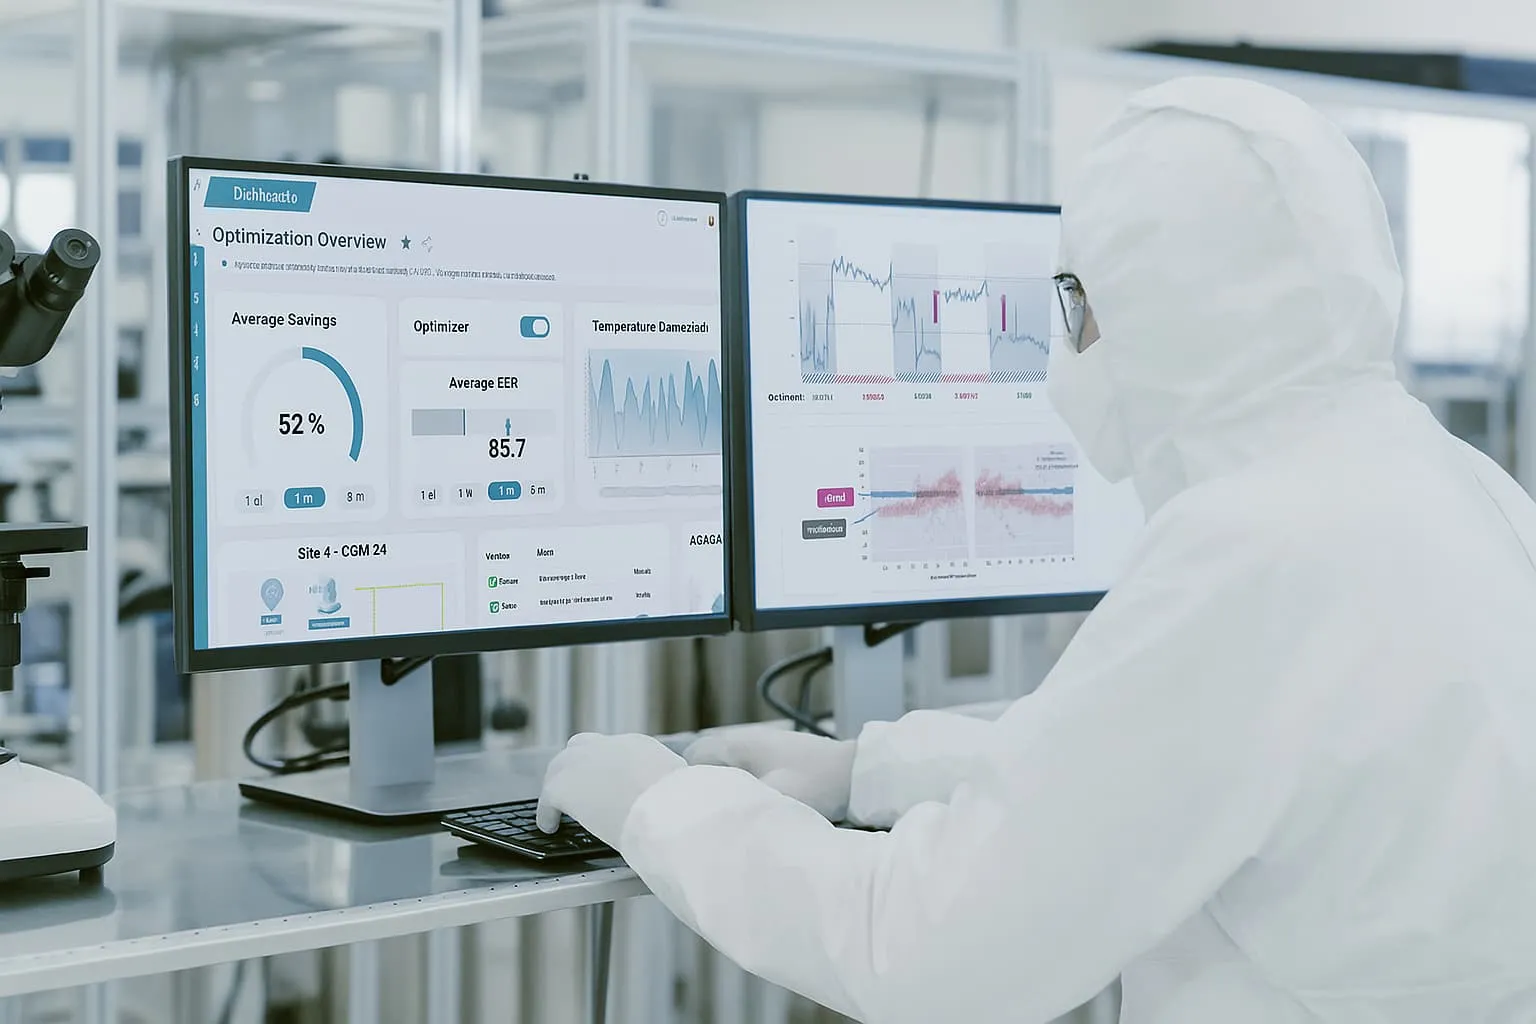
Improve HVAC and utility efficiency while maintaining stable environmental conditions, compliance requirements, and operational boundaries.

Coordinate cooling, heating, ventilation, thermal utilities, and electrical infrastructure under fluctuating production loads and changing energy prices.

Improve performance in complex HVAC environments where demand, occupancy, weather, and operating schedules change continuously.
Equinix, Merck, and others achieve up to 50% cooling energy savings with etalytics. Explore our case studies.


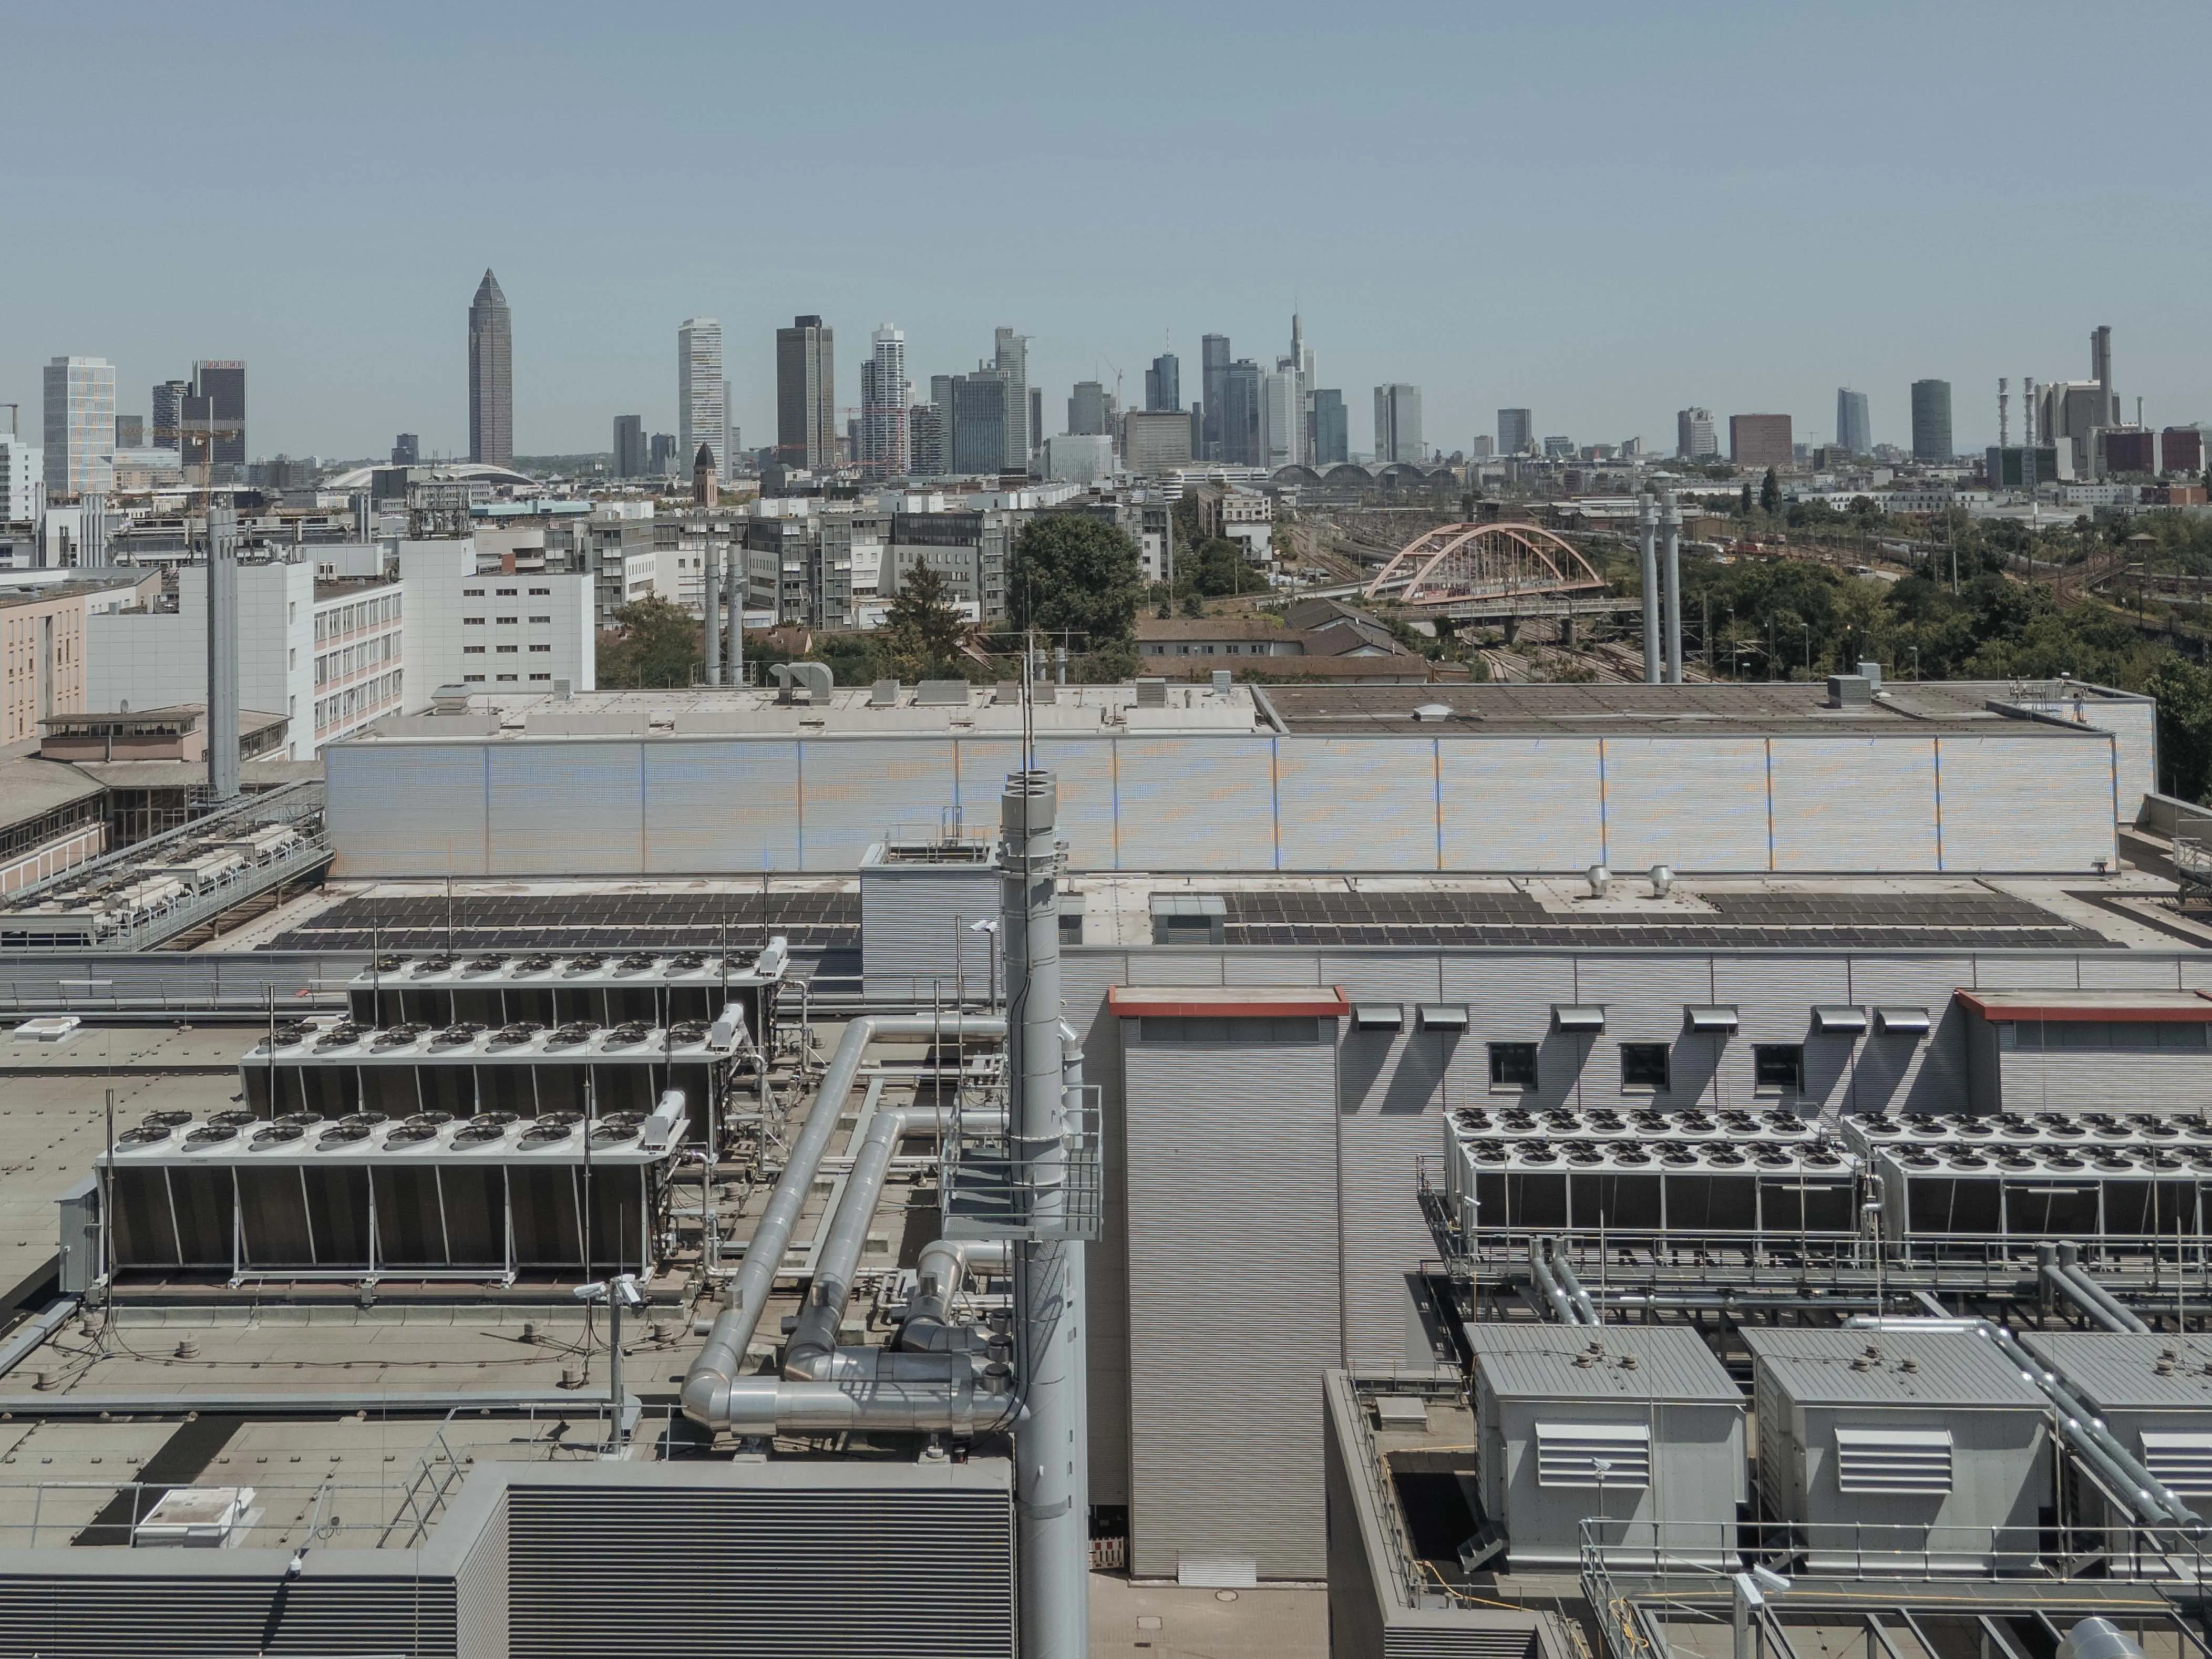
"With the help of etalytics' expertise, we are implementing AI-based operational optimization of the cooling systems at the Frankfurt site [...]. We are thus supporting a highly innovative approach that can serve as a blueprint for an entire industry."
Structured reporting does more than simplify compliance. It creates a trusted operational data foundation that supports benchmarking, predictive analytics, and continuous optimization across the organization.
Use the feasibility study to determine how etaONE® can reduce manual preparation, standardize recurring calculations, and improve the handoff between energy, operations, finance, and sustainability teams.
Trusted by operators across data centers and industry





We empower industries to make complex energy systems and operations more intelligent, efficient, and resilient — with AI and digital twins that operators can trust.
















.webp)