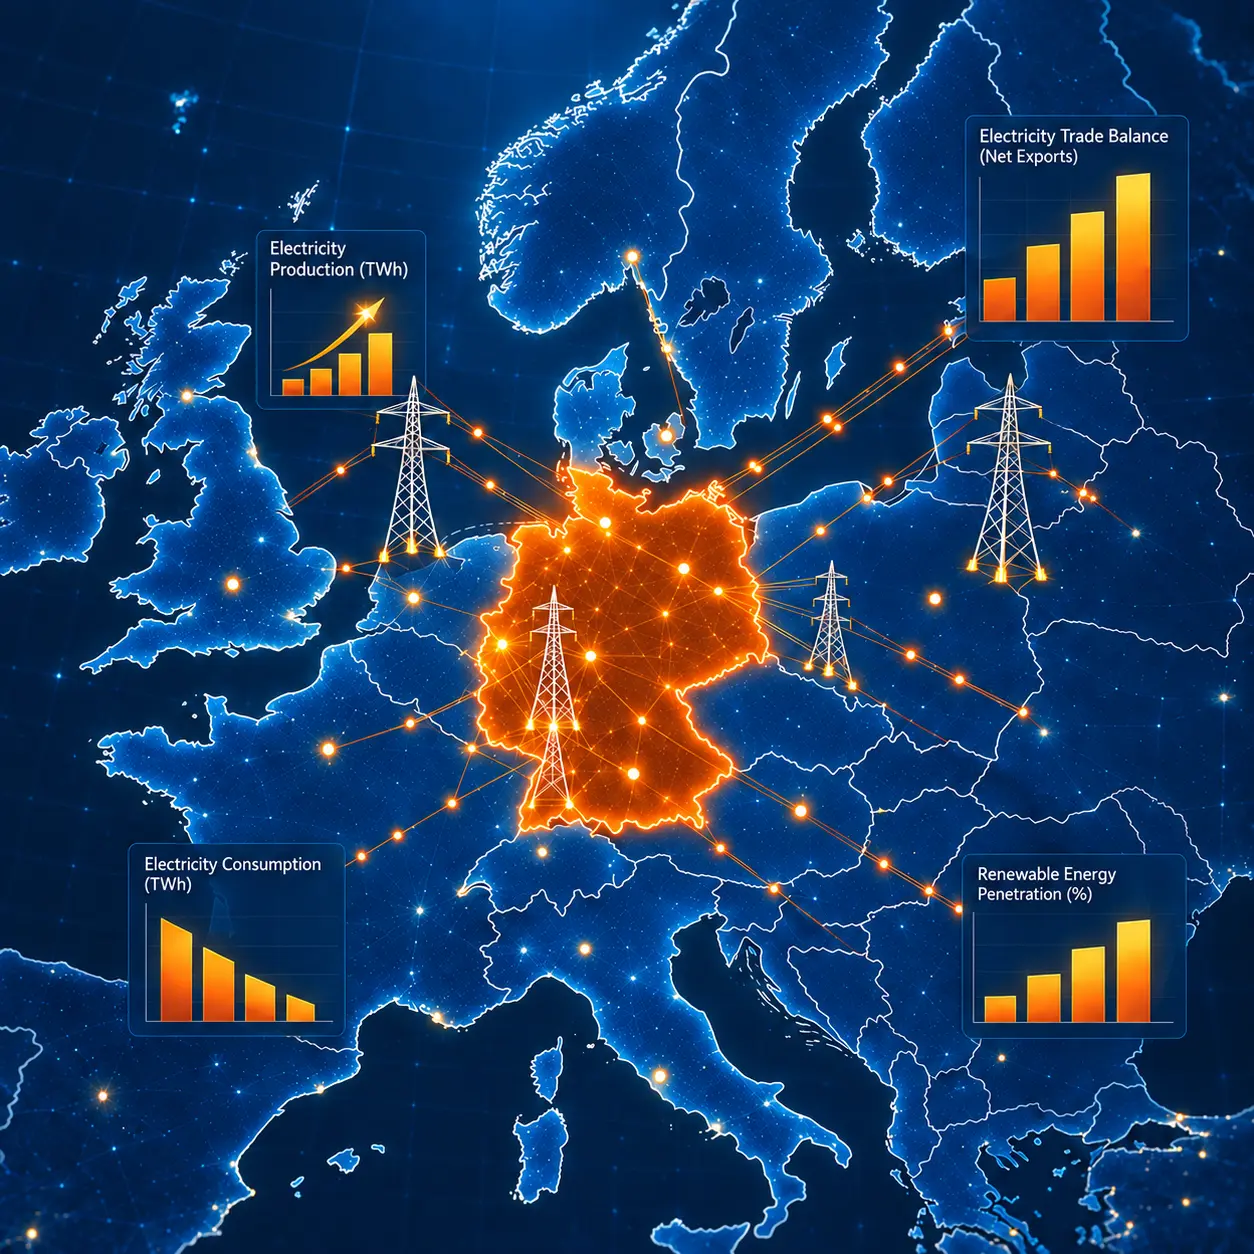
Germany’s non-household electricity price in Eurostat consumption band IC was 22.64 ct/kWh in the second half of 2025, covering annual use between 500 and 2,000 MWh.The corresponding EU average was 18.37 ct/kWh. Germany was therefore 4.27 ct/kWh, or approximately 23% above the EU average for this specific consumption band and tax definition.(Source: Eurostat.)
This does not mean that every German industrial company paid 22.64 ct/kWh. International comparisons change when the consumption band, tax treatment, relief mechanisms, contract structure, or reporting period changes. The figures are useful only when their definitions are aligned.
For current German price benchmarks from SMARD, VEA/BDEW, and Destatis, see What Is the Current Industrial Electricity Price in Germany in 2026?. For the historical trend from the energy crisis through 2026, see How Has the Industrial Electricity Price in Germany Developed?.
Germany’s Industrial Electricity Price Compared with the EU Average
Eurostat reports non-household electricity prices in euros per 100 kWh. The numerical value is identical when expressed in ct/kWh. For example, €22.64 per 100 kWh equals 22.64 ct/kWh or €0.2264/kWh.
The unit conversion is easy to misread
Eurostat’s €22.64 per 100 kWh is equivalent to 22.64 ct/kWh, not €22.64 per kWh. A figure stated as €22.64/kWh would be too high by a factor of 100.
How Does Germany Compare with Selected EU Countries?
For Eurostat band IC in the second half of 2025, Ireland and Cyprus reported higher non-household electricity prices than Germany. Finland and Sweden reported the lowest values among the countries highlighted by Eurostat. All values in the comparison below use the same period, consumption band, and X_VAT tax definition.
.webp)
Germany was the third-highest country in Eurostat’s published IC-band summary, behind Ireland at 25.52 ct/kWh and Cyprus at 24.29 ct/kWh. Finland was lowest at 7.48 ct/kWh, followed by Sweden at 9.70 ct/kWh. (Source: Eurostat.)
In 18 EU countries, prices declined compared with the second half of 2024. Eurostat reported the largest reductions in Slovenia, Luxembourg, and France, while five countries recorded increases. These changes show that the European average can fall even while individual national markets move in different directions. (Source: Eurostat.)
Change in EU Average Since the Energy Crisis
The EU average for non-household consumers in band IC has generally declined since the first half of 2023, although the path has not been linear. The average fell from 21.51 ct/kWh in the first half of 2023 to 18.37 ct/kWh in the second half of 2025, a reduction of approximately 14.6%. (Source: Eurostat.)
The decline in the EU average does not establish that Germany’s relative competitiveness improved or worsened over the same period. A consistent German time series using the same band and tax definition would be required to measure the gap over time.
Consumption Band and Industrial Electricity Price Variation
Electricity price comparisons can change substantially when a different annual consumption band is selected. Larger consumers often connect at higher voltage levels, purchase greater volumes, and may qualify for different relief mechanisms.
For Germany, Eurostat’s IC-band value was 22.64 ct/kWh in the second half of 2025 for consumers using 500-2,000 MWh annually. In the separate 20-70 GWh band, Germany’s second-half 2025 value was 16.0 ct/kWh, excluding recoverable taxes. (Sources: Eurostat; Eurostat reproduced by BDEW.)
Do not compare across bands as if they were the same market
Germany’s 22.64 ct/kWh IC-band value and 16.0 ct/kWh 20-70 GWh value describe different consumer groups. The lower large-consumer figure does not contradict the IC-band result, and neither should be used as a universal German industrial electricity price.
The 16.0 ct/kWh value is also a second-half 2025 figure. The 15.9 ct/kWh value cited in some BDEW material is a separate full-year 2025 German series. Period and methodology must be stated whenever either value is used.
Industrial Electricity Price in Germany Compared to the United States and China
The International Energy Agency reports that EU electricity prices for energy-intensive industries remained more than twice the US level and nearly 50% above China in 2025. These are regional competitiveness indicators rather than directly comparable national retail tariffs. (Source: IEA.)
The IEA comparison uses European consumers above 150 GWh per year and includes electricity-price compensation for participating EU ETS countries. The US benchmark is based on final industrial electricity prices in Texas, while the US and China values are described as indicative averages. Actual prices vary by industry, location, and consumption level. (Source: IEA.)
.webp)
The IEA chart includes Germany, but the accompanying downloadable text does not provide an exact standalone German value. An exact figure should therefore not be inferred from the visual.
Why International Electricity Price Comparisons Require Context
A credible comparison must align the underlying definitions before countries are ranked. The same country can appear more or less competitive depending on which industrial consumer profile is selected.
A national average is a useful competitiveness signal, but it cannot reproduce the final electricity cost of a specific industrial site. Company-level exposure also depends on hedging, power purchase agreements, on-site generation, grid tariffs, and operational flexibility.
Suggestions for Industries in Germany
Germany’s above-average IC-band price indicates a structural cost challenge for electricity-dependent companies, but it does not determine the business case of an individual site. Companies can influence the effective cost through procurement, efficiency, peak-load management, and flexible operation.
- Benchmark against the correct consumption band rather than a generic national average.
- Separate the commodity price from network costs, taxes, supplier costs, and reliefs.
- Compare new-contract exposure with the prices embedded in existing hedges and long-term agreements.
- Evaluate whether flexible loads can respond to low-price and high-price periods without compromising production.
- Connect market-price signals with cooling, heating, ventilation, storage, and on-site generation constraints.
For a practical explanation of how operating strategy can reduce cost exposure, see Energy Flexibility vs. Energy Efficiency in Industry. The article explains why using less energy and using energy at better times are complementary levers.
How Does Germany’s Industrial Electricity Price Support Affect the Comparison?
Germany’s 2026-2028 support scheme is intended to reduce the competitiveness burden for eligible electricity-intensive and trade-exposed sectors. However, the widely discussed 5 ct/kWh value is a floor used in the aid calculation for part of eligible consumption. It is not the complete delivered electricity price and should not replace Eurostat or IEA market comparisons.
The eligibility rules, supported consumption share, other relief mechanisms, and EU state-aid conditions are explained in Industrial Electricity Price in Germany. The reinvestment obligations attached to the support are covered in Industrial Electricity Price: Why Relief Is Tied to Investment.