
Industrial electricity prices in Germany cannot be reduced to one universal number. The latest available indicators measure different customer groups, contract types, periods, and tax treatments. A useful answer, therefore, depends on whether a reader needs a current modeled benchmark, a new-contract price, or an observed average from reported supplier data.
This article focuses on modeled, new-contract, and observed electricity-price benchmarks. For the rules, eligibility criteria, and the 5 ct/kWh calculation floor used by Germany’s subsidized industrial electricity price scheme, see Industrial Electricity Price in Germany: Costs, Rules, and Impact 2026-2028. For the reinvestment obligations attached to the support scheme, see Industrial Electricity Price: Why Relief Is Tied to Investment.
Current Industrial Electricity Price Benchmarks at a Glance
The most useful current benchmark depends on the question being asked. The following figures should be read side by side, not combined into one average.
Table 1. Current industrial electricity price benchmarks by source, from 10.73 to 19.22 ct/kWh.
The Latest 2026 New-Contract Data
The available indicators include an SMARD-modeled scenario of 10.73 ct/kWh with maximum reductions and a VEA April 2026 new-contract observation of 17.9 ct/kWh, reproduced by BDEW. These figures represent different methodologies and customer scopes and must not be treated as the lower and upper limits of one market-price range.
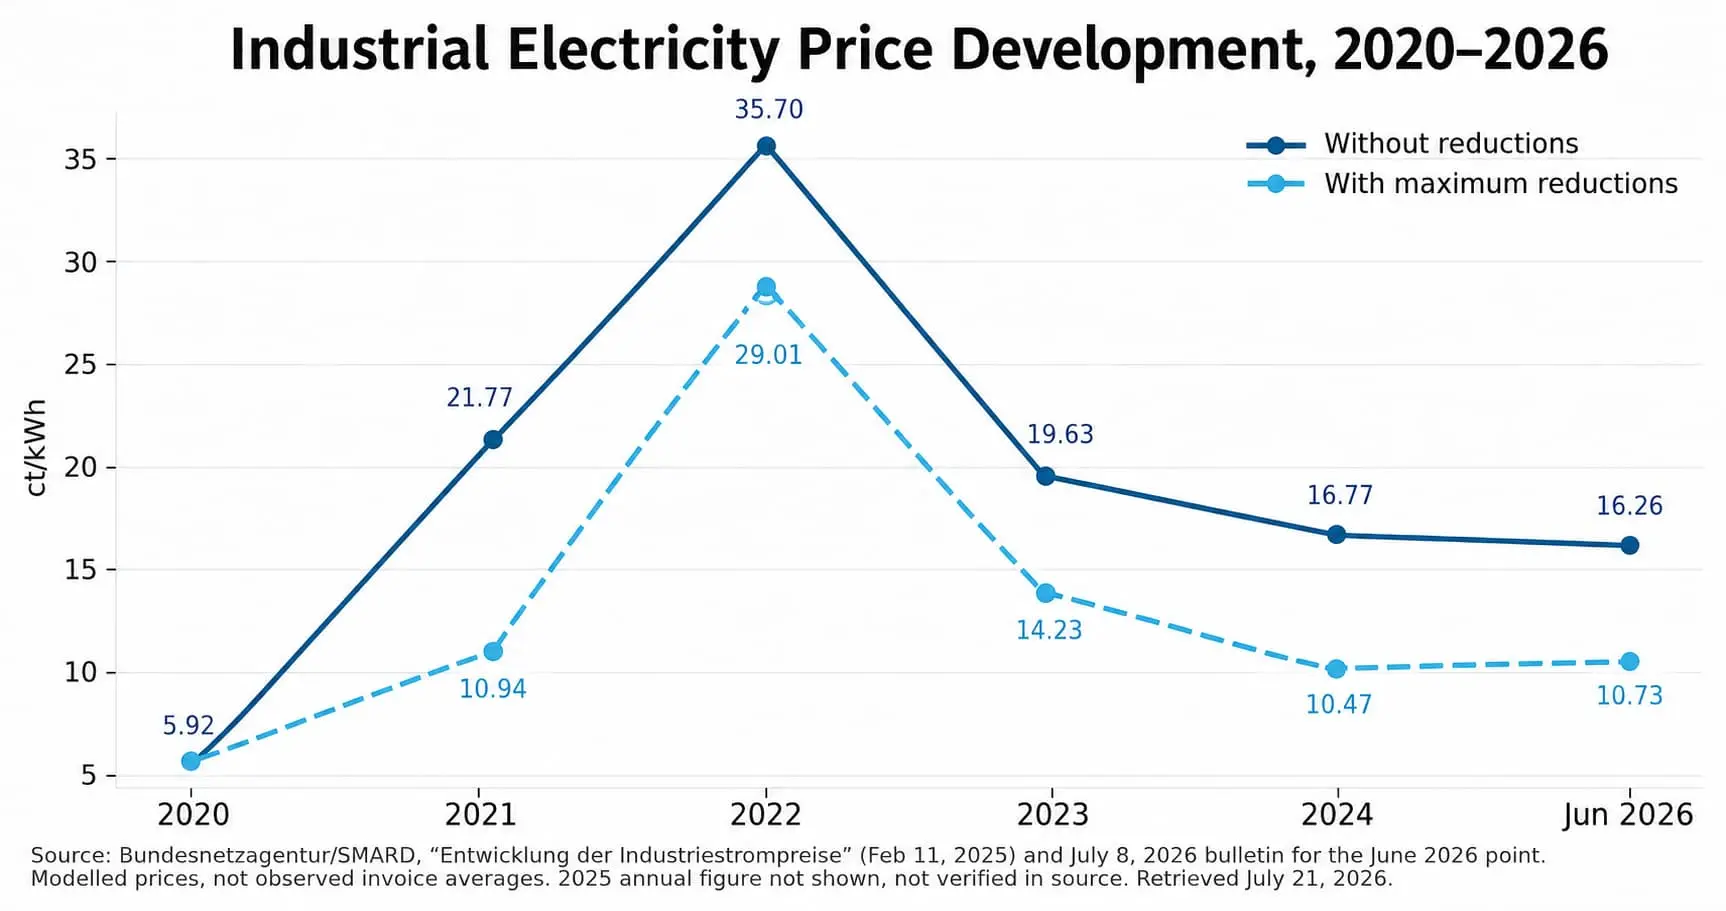
The VEA monthly series reproduced in BDEW’s April analysis shows that prices for newly signed contracts, with supply beginning in the second half of 2026, increased for the selected small and medium-sized industrial profiles during the first four months of 2026. The series reports 16.0 ct/kWh in January, 16.0 ct/kWh in February, 16.9 ct/kWh in March, and 17.9 ct/kWh in April. (Source: VEA, reproduced by BDEW.)
Table 2. VEA's monthly new-contract prices, January-April 2026.
The Q1 value of 16.3 ct/kWh is the average of the January, February, and March observations. The 16.7 ct/kWh headline value includes April and is therefore a January-April average. Neither should be described as a full-year 2026 price.
What Is the Average Industrial Electricity Price in Germany?
The latest broad official average is 19.22 ct/kWh for German non-household consumers in the second half of 2025, excluding VAT and other recoverable taxes. It is the broadest current official non-household benchmark, but it is not a manufacturing-only average and should not be interpreted as the price paid by a representative industrial plant. (Source: Destatis.)
The term "average industrial electricity price” can therefore be misleading when the customer profile is not specified. The Destatis total combines all non-household consumption classes, including companies, commercial operations, and public bodies. It should be used as a national reference point, not as a substitute for an individual company’s contract or invoice data.
How Is the Average Industrial Electricity Price Calculated?
Destatis calculates the average from selling prices reported by electricity suppliers and weights the results by the quantities sold within defined annual consumption classes. The national value is therefore an electricity-volume-weighted average, not a simple average that gives every tariff or company equal weight.
Eurostat publishes the harmonized German data in dataset nrg_pc_205. The data cited in this article covers the second half of 2025 and was updated in May 2026. Every Eurostat figure should be published with its reporting period, annual consumption band, and tax dimension. (Sources: Destatis; Eurostat.)
Table 3. Eurostat's three electricity price tax definitions: X_TAX, X_VAT, and I_TAX.
The overall H2 2025 non-household average was 19.22 ct/kWh under the X_VAT definition. The 2,000-20,000 MWh consumption band also happened to report 19.22 ct/kWh in the same period. These are separate rows in the dataset and should not be confused.
Industrial Electricity Prices by Consumption Band
Industrial electricity prices generally decrease as annual consumption rises, although company size alone does not determine the result. Voltage level, load profile, procurement conditions, and access to relief also affect the effective price.
Small non-household consumers using less than 20 MWh annually paid an average of 32.58 ct/kWh in the second half of 2025, while consumers using above 150 GWh paid 13.07 ct/kWh. Both values exclude VAT and other recoverable taxes.
(Source: Destatis.)
For five small and medium-sized industrial profiles consuming between 160,000 kWh and 20 GWh annually, the VEA series reproduced by BDEW reports an average new-contract price of 16.7 ct/kWh for contracts observed from January to April 2026 and beginning supply in the second half of 2026.
(Source: VEA, reproduced by BDEW.)
For larger industrial consumers, the updated full-year 2025 Eurostat values reproduced by BDEW are:
- 15.9 ct/kWh for 20-70 GWh per year
- 14.4 ct/kWh for 70-150 GWh per year
(Source: Eurostat, reproduced by BDEW.)
BDEW’s January 2026 edition reported 15.8 ct/kWh for the 20–70 GWh band and 14.5 ct/kWh for the 70–150 GWh band, based on the Eurostat data then available for the first half of 2025. The April 2026 edition incorporated the complete 2025 data and updated the values to 15.9 ct/kWh and 14.4 ct/kWh, respectively. No 2026 figures were yet available for these bands.
No 2026 Eurostat figures for the 20-70 GWh and 70-150 GWh groups were available in BDEW’s April 2026 analysis as of July 21, 2026. They should not be extrapolated from the smaller-consumer series.
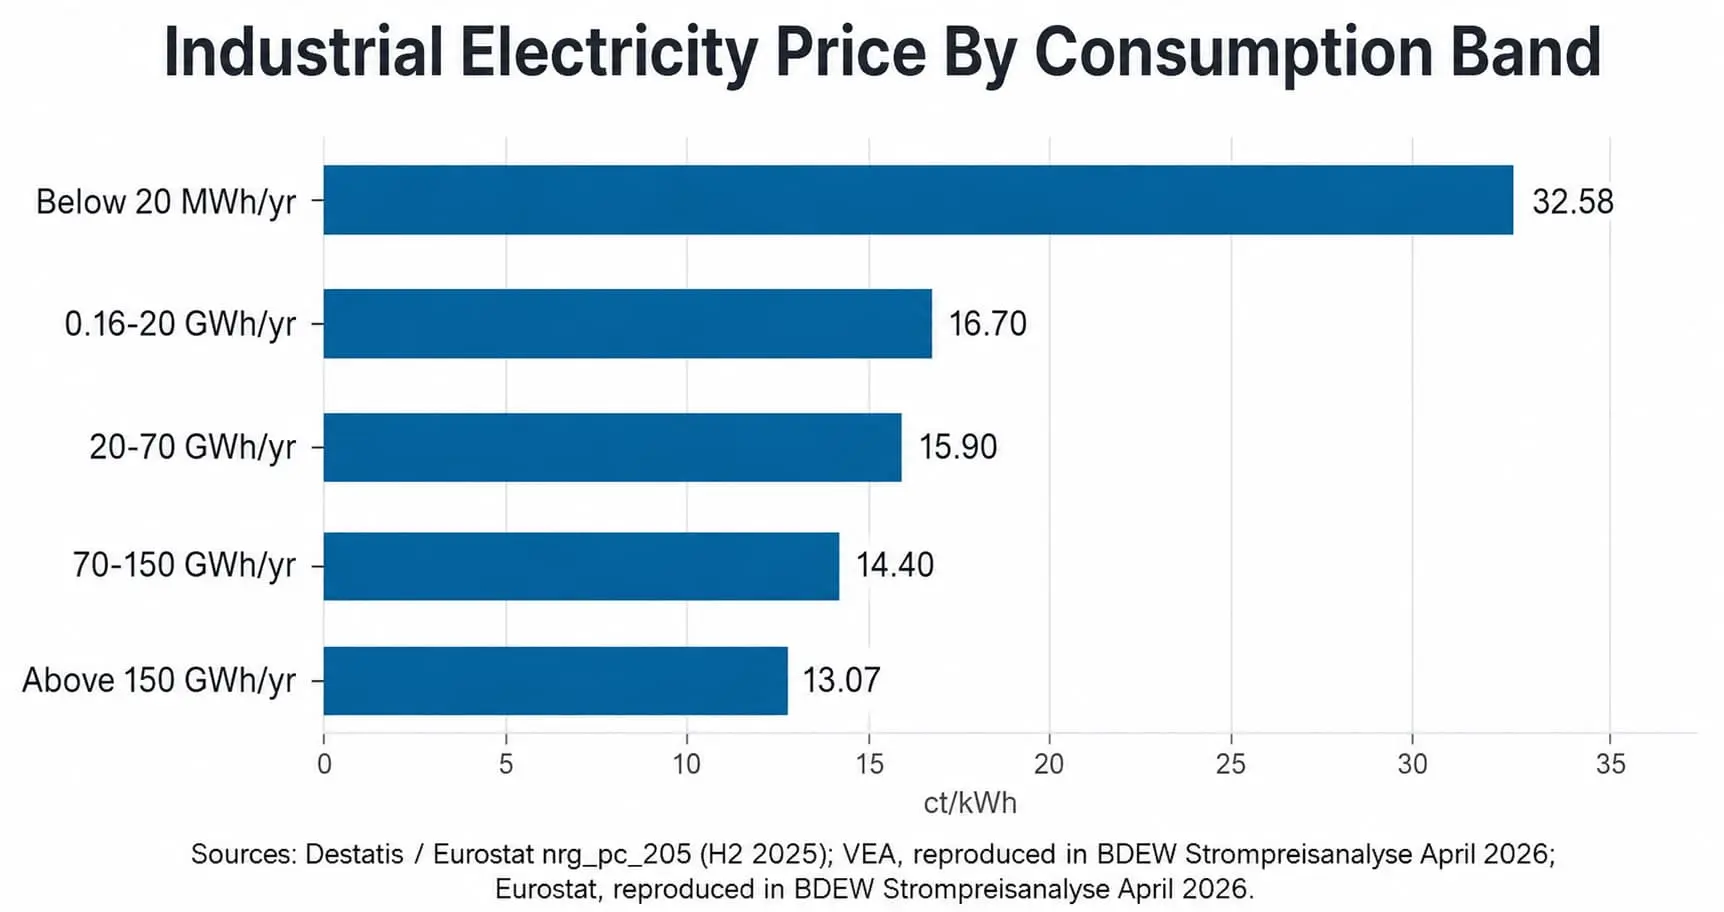
The observed price generally declines as annual consumption rises. Larger consumers often connect at higher voltage levels, have more predictable load profiles, procure larger volumes, and may have access to relief mechanisms that smaller users do not. Annual consumption alone, however, does not determine the final price.
Why Do Industrial Electricity Price Figures Differ Between Sources?
The figures differ because the sources are designed to answer different questions. A modeled monthly benchmark, a new-contract quote, and an observed six-month average are not competing estimates of the same metric.
Table 4. Eight reasons industrial electricity price figures differ between sources.
For example, the VEA/BDEW value of 16.7 ct/kWh is a January-April 2026 average for selected new contracts. Destatis’ 19.22 ct/kWh is a quantity-weighted second-half 2025 average across all non-household consumption classes. Averaging the two would not produce a meaningful German industrial electricity price.
Older publications may also contain legitimate interim values. A figure available during 2025 may differ from the updated annual value published in 2026 because additional contract or Eurostat data became available.
The same principle applies to the VEA new-contract series reproduced by BDEW. In 2023, 21.6 ct/kWh represented procurement, network charges, and distribution. The full new-contract price was 24.5 ct/kWh after taxes, levies, and surcharges were included. (Source: VEA, reproduced by BDEW.)
New Contracts Versus Existing Electricity Contracts
Prices for newly signed electricity contracts can respond to current procurement conditions more quickly than the average prices paid under existing contracts. The VEA series for small and medium-sized industrial profiles reproduced by BDEW only includes new contracts with delivery beginning in the next half-year. It therefore reflects current supplier offers and procurement conditions more quickly than Destatis' observed average.
Existing contracts may reflect the following:
- Fixed prices agreed in an earlier market period
- Multi-year hedging or staggered procurement
- Spot-linked or index-linked supply
- Power purchase agreements
- On-site generation
- Contract-specific volume tolerances and balancing rules
A decline in wholesale prices will therefore not immediately reduce every company’s electricity bill. Conversely, an existing hedge can protect a company when current market prices rise.
How Is the Industrial Electricity Price in Germany Calculated?
The delivered industrial electricity price is calculated by adding procurement, supplier, network, and statutory costs, then subtracting any reliefs for which the company qualifies. The weighting of these components differs between sites and contracts.
Industrial electricity price = procurement and supplier costs + grid fees + taxes and statutory charges - eligible industrial reliefs
Energy Procurement Costs
Energy procurement costs depend on how and when electricity is purchased. Procurement can include day-ahead and intraday purchases, monthly and quarterly products, annual futures, fixed-price supply agreements, power purchase agreements, and on-site generation.
SMARD calculates modeled procurement costs monthly using day-ahead prices, monthly and quarterly products, and annual futures. The products are weighted according to procurement strategies observed through Bundesnetzagentur monitoring. Spot-linked procurement reacts quickly to market changes. A highly hedged strategy offers greater price stability but may delay the benefit of falling wholesale prices. (Source: Bundesnetzagentur/SMARD.)
Grid Fees
Grid fees finance the operation, maintenance, and expansion of electricity networks. Industrial charges can include a consumption-based charge, a capacity charge based on maximum demand, metering costs, upstream network costs, and site-specific arrangements.
The result depends on the network operator, voltage level, peak load, annual consumption, and operating hours. The German government is providing a €6.5 billion subsidy for transmission network charges in 2026. The measure benefits consumers generally and is separate from the targeted industrial electricity price program. (Source: German Federal Government.)
Individual grid-charge reductions may also be available for atypical or particularly intensive network use. They must be assessed for each site and cannot be inferred from annual consumption alone.
Taxes, Levies, and Statutory Charges
Taxes and statutory charges can include electricity tax, concession fees, network-related levies, and VAT where it cannot be recovered. The standard German electricity tax rate is €20.50/MWh, equivalent to 2.05 ct/kWh. Eligible companies can receive relief of €20/MWh, leaving an effective burden of €0.50/MWh, equivalent to 0.05 ct/kWh. (Source: German Customs.)
The effective statutory burden depends on the company’s legal sector classification, how the electricity is used, whether taxes are recoverable, minimum thresholds, application requirements, and eligibility for relief or exemptions.
Supplier Costs and Margins
Supplier costs and margins cover the commercial activities and risks involved in electricity supply. They can include trading and hedging, load forecasting, balancing energy, billing, credit risk, volume risk, customer administration, and the supplier margin.
SMARD assumes that distribution costs and margin account for approximately 5% of its modeled industrial electricity price. This is a modeling assumption, not an observed margin that applies to every supplier or contract. (Source: Bundesnetzagentur/SMARD.)
Industrial Reliefs and Exemptions
Industrial rebates can reduce electricity tax, network charges, statutory levies, or part of the wholesale-price burden. Relevant mechanisms include reduced electricity tax, process-specific electricity-tax relief, individual grid-charge arrangements, the Besondere Ausgleichsregelung, electricity-price compensation, the subsidized industrial electricity price support scheme for 2026–2028, and the federal transmission-network subsidy.
Each mechanism has its own legal basis, eligible sectors, supported volumes, and application procedure. Qualification for one mechanism does not automatically establish eligibility for another, and state aid rules can restrict double funding of the same electricity volume. (Source: BMWE.)
For a detailed explanation of the 2026-2028 scheme and its interaction with other relief measures, see Industrial Electricity Price in Germany: Costs, Rules, and Impact 2026-2028. The investment and evidence requirements are covered separately in Industrial Electricity Price: Why Relief Is Tied to Investment.
Which Benchmark Should a Company Use?
No national benchmark can replace a company’s own contract and invoice data. The appropriate external reference depends on the decision being made:
- Use the SMARD model to track the current direction of a modeled delivered industrial price and to compare the impact of modeled reductions.
- Use the VEA series reproduced by BDEW when evaluating recent new-contract conditions for small and medium-sized industrial profiles within its stated scope.
- Use Destatis or Eurostat for observed benchmarking against a defined consumption band and tax basis.
- Use the company’s actual contract, grid tariff, load profile, taxes, and relief status to estimate site-specific costs
Price benchmarking is only the first step. Companies that want to reduce their effective electricity cost also need to connect procurement decisions with efficiency, peak demand, and flexible operation. See Energy Flexibility vs. Energy Efficiency in Industry for a practical explanation of how these levers work together.
Relationship to Germany’s Industrial Electricity Price Support Scheme
The modeled, new-contract, and observed prices in this article should not be confused with Germany’s subsidized industrial electricity price support scheme. The widely discussed 5 ct/kWh level is a floor used in the aid calculation for part of eligible consumption and applies only to qualifying companies. It is not the complete delivered electricity price paid by an eligible company, nor is it available to every industrial company.
The eligibility rules, supported consumption share, application process, and interaction with other relief measures are explained in Industrial Electricity Price in Germany: Costs, Rules, and Impact 2026-2028. The separate article Industrial Electricity Price: Why Relief Is Tied to Investment focuses on the reinvestment and transformation requirements.
What Should Companies Watch Next?
The current picture will change as new monthly, semester, and annual data are published. The most important updates are the following:
- Monthly SMARD values for modeled prices with and without reductions.
- Later BDEW electricity-price analyses and the underlying VEA new-contract series.
- Destatis and Eurostat data for the first half of 2026, including updated consumption-band comparisons.
- Changes in wholesale prices, gas markets, renewable output, grid charges, and contract conditions.
Market volatility increasingly interacts with physical operating constraints. The Etalytics article Extreme Weather Is Redefining Industrial Energy Management explains why price exposure, cooling demand, weather, and operational resilience can no longer be managed separately.


Sources
Sources were retrieved on July 22, 2026. Links are listed in order of first appearance.
1. Bundesnetzagentur / SMARD, “Stabile Haushaltskundenpreise für Strom und Gas," published July 8, 2026. Source for the May and June 2026 modeled industrial electricity prices.
2. Bundesnetzagentur / SMARD, "Industriestrompreise."“Industriestrompreise”. Methodology page for the modeled price components and procurement assumptions.
3. VEA, reproduced in BDEW, “BDEW-Strompreisanalyse April 2026,” published April 15, 2026. Source for the small- and medium-industry new-contract series and methodology. BDEW’s continuously updated Strompreisanalyse is available here.
4. Destatis, “Strompreise für Haushalte im 2. Halbjahr 2025 um 1,6 % gestiegen," press release No. 111, published March 31, 2026. Source for the blended non-household average and methodological notes.
5. Destatis GENESIS-Online, table 61243-0005, "Strompreise für Nicht-Haushalte: Deutschland, Halbjahre, Jahresverbrauchsklassen, Preisarten." Source for H2 2025 prices by consumption band and tax treatment.
6. Eurostat, dataset nrg_pc_205, “Electricity prices for non-household consumers, bi-annual data," updated May 2026. Harmonized dataset for consumption bands and the X_TAX, X_VAT, and I_TAX dimensions.
7. German Federal Government, "Niedrigere Netzentgelte“NiedrigereNetzentgelte für 2026." Source for the €6.5 billion federal subsidy for transmission network charges in 2026.
8. German Customs, "Strom." Source "Strom." Source for the standard German electricity tax rate.
9. German Customs, “Steuerentlastung für Unternehmen nach § 9b StromStG." Source for the electricity-tax relief available to eligible companies.
10. BMWE, “Im Fokus: Wettbewerbsfähige Strompreise - Industriestrompreis entlastet die Industrie," published May 26, 2026, in issue 06/2026. Source for the interaction of industrial relief mechanisms and double-funding restrictions.