Book Demo
Book Demo
etalytics gives operators live insights into energy flows, asset performance, and carbon impacts. Building the foundation for AI-driven optimization.
.webp)


Industrial energy systems are complex, with vast amounts of assets, data streams, and dynamic internal & external influences. Without clear visibility, inefficiencies remain hidden, compliance is difficult, and costs spiral.

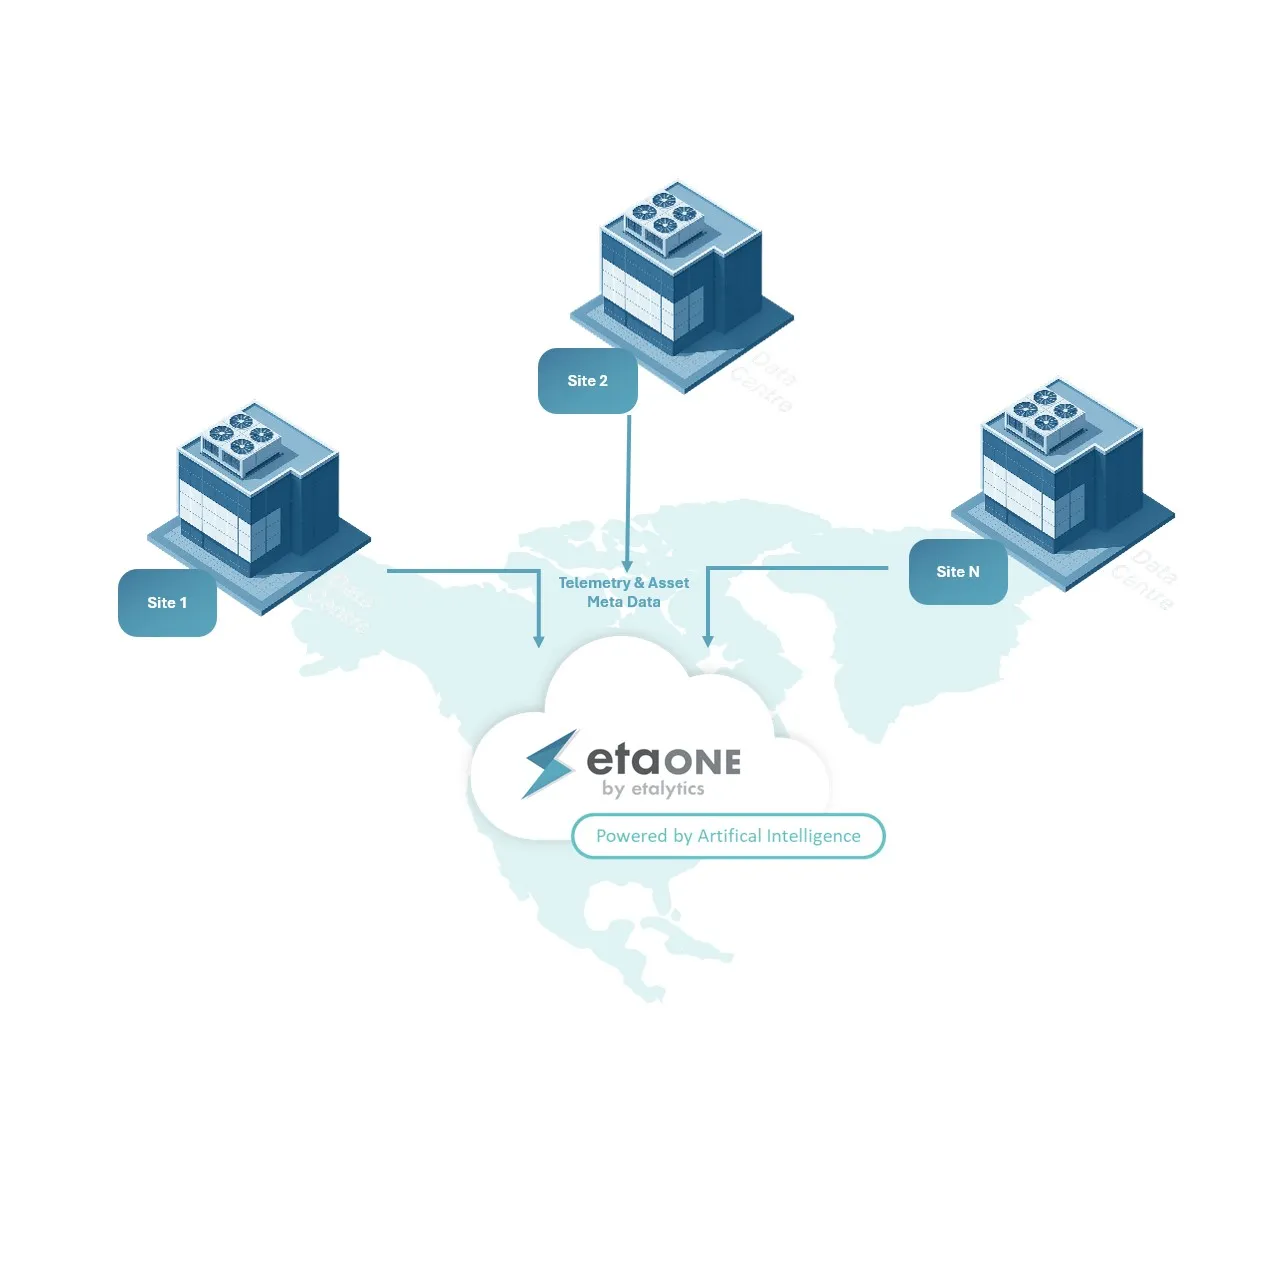
etaONE not only retrieves telemetry data from meters, sensors, BMS/SCADA, and IoT devices – it enriches it with appropriate metadata. Every asset is mapped in a clean hierarchy, with any level of detail:
This metadata-driven foundation enables advanced benchmarking, reporting, and optimization that operators can trust.
With vendor-independent connectors and open APIs, etaONE integrates BMS/SCADA, IoT, and meters. All data is normalized and enriched with metadata for clean, reliable analytics.


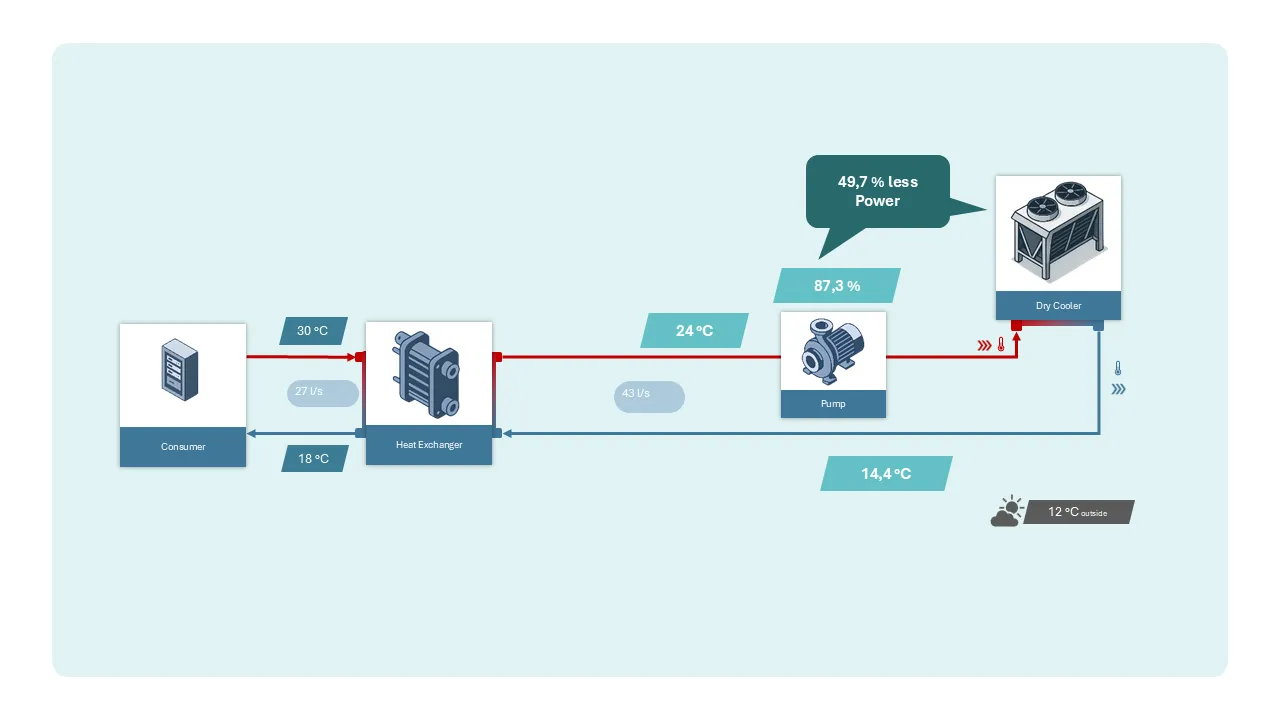
Monitor electricity, cooling, heating, and ventilation systems with second-level granularity. Drill down from a site-wide view to a single component, and immediately be notified about anomalies.
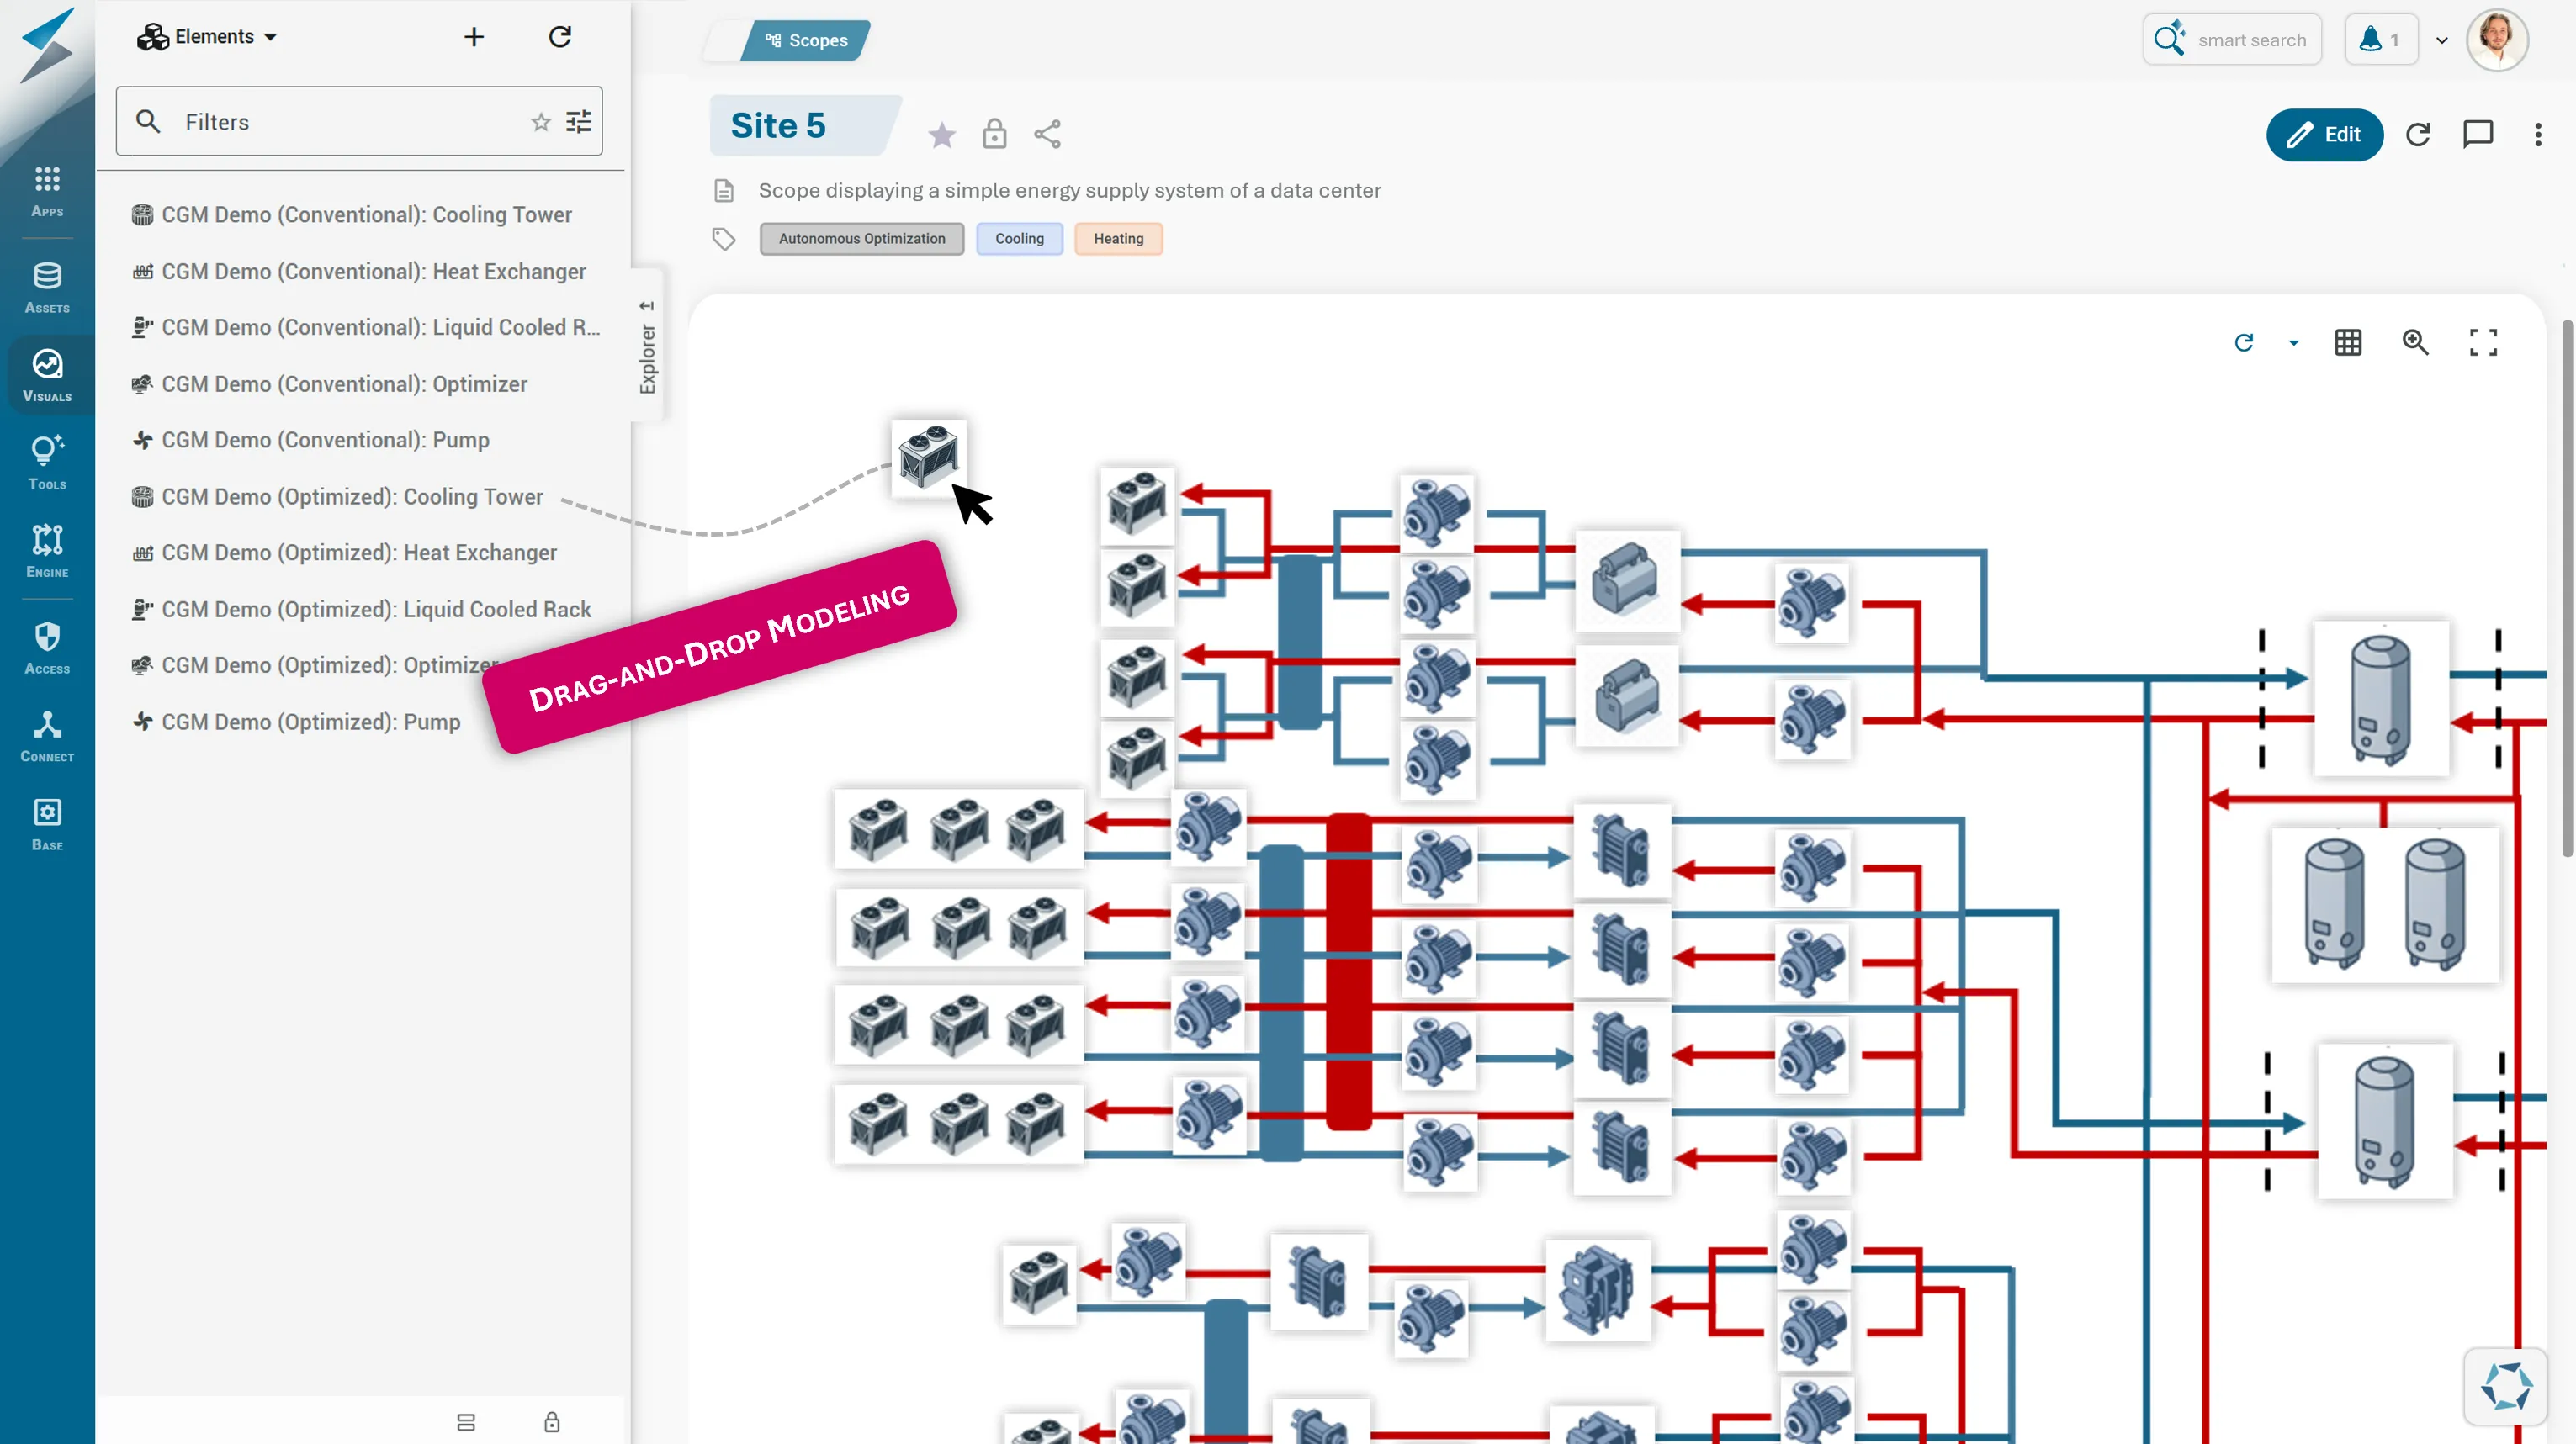
Industrial energy systems are complex networks of assets – pumps, heat exchangers, valves, chillers, cooling towers, and more. Traditional dashboards show numbers, but don’t reveal how assets interact. With Energy Transparency, operators gain a live system view that makes interconnections, flows, and anomalies visible at a glance. This helps identify bottlenecks, inefficiencies, or risks much faster.

Benchmark KPIs across sites and assets, detect performance drift, and prioritize corrective actions. Turn complexity into actionable comparisons that guide investments.

Build compliance into daily operations. etalytics automates reporting for energy efficiency, carbon accounting, and regulatory frameworks. All metadata and telemetry data is traceable and exportable.
Compare dozens of facilities by cost, utilization, and emissions. Drill down from a map view to individual assets, keeping consistency across the entire portfolio.
By establishing transparent baselines across thousands of assets, operators gain a consistent and reliable view of their entire energy system. Performance gaps become visible, compliance reporting is streamlined, and decisions are made with confidence.
Build reliable baselines, simplify reporting, and prepare for the next step: foresight and autonomy with AI.
Trusted by operators across data centers and industry


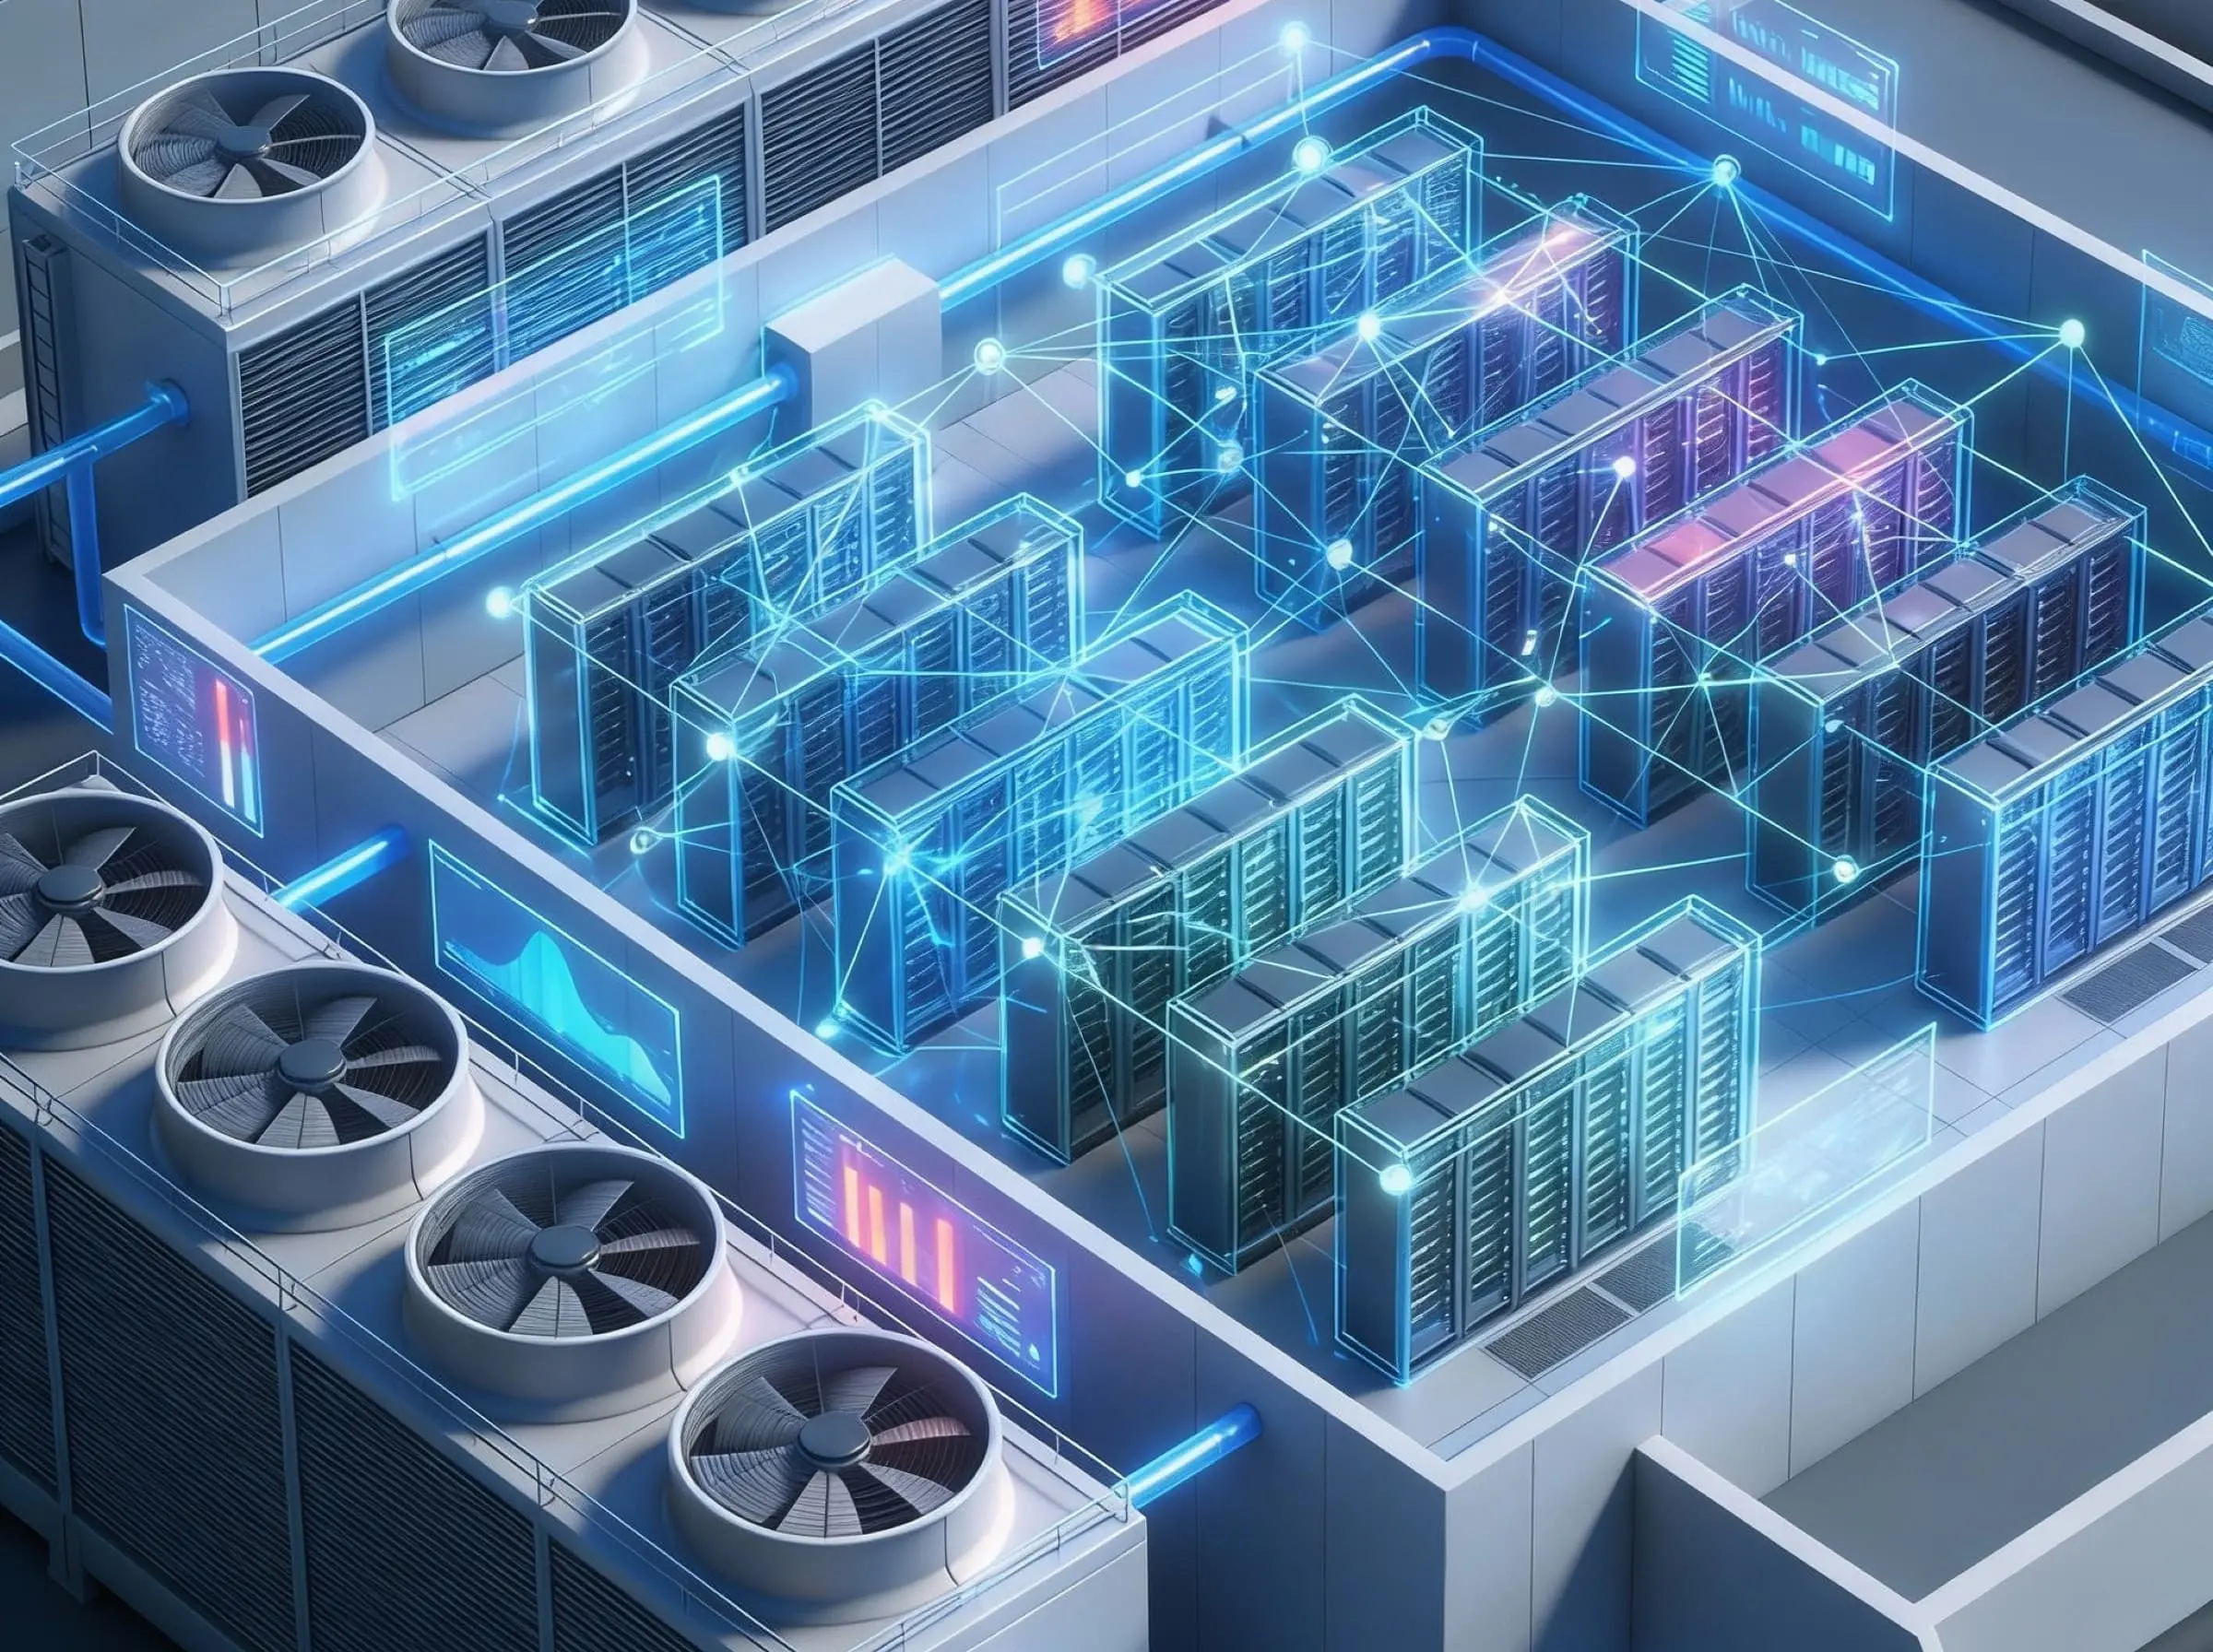
We empower industries to make complex energy systems and operations more intelligent, efficient, and resilient — with AI and digital twins that operators can trust.


.webp)